The decision to purchase real estate or to place your home for sale in the Santa Barbara real estate market can be one of the biggest you and your family will make at any given time. This decision can be made easier if you are adequately informed about the buying and selling process, the local real estate market and the neighborhoods and communities in which you are interested. As a local real estate professional with more than thirty years of experience helping buyers and sellers just like you, it would be my great pleasure to introduce you to the Santa Barbara Real Estate Services I offer to both buyers and sellers.
For sake of simplicity, buying a home is a three-step process: finding the right community, finding the right home and negotiating the best contract terms. For your convenience, I have compiled a wealth of information on local communities and their real estate trends as well as provided you access to the search the entire Santa Barbara MLS to view available properties. Once we have narrowed down the ideal community and the right home, I will use my many years of experience and expertise and my Santa Barbara Real Estate Services to negotiate the contract terms to suit your needs and to exceed your expectations.
For sellers, I believe you will find my commitment to untiring communication and service, masterful marketing and negotiation skills to be most refreshing. Resulting from years of extensive experience and research, a superior ability to anticipate problems and solve them and unsurpassed ethics and professionalism, you will find these qualities will help your home sell quickly and for its highest dollar.
Whether you are moving across town or across the country, it would be my great pleasure to assist you with all your housing needs and to share my Santa Barbara Real Estate Services with you and your family. Please feel free to browse my Santa Barbara Home Buying and Selling Tips at your leisure and do not hesitate to contact me, Stan Tabler at your convenience. I look forward to hearing from you soon and assisting you with all your real estate goals, big and small.
Santa Barbara South Coast Real Estate Update
June 14, 2026
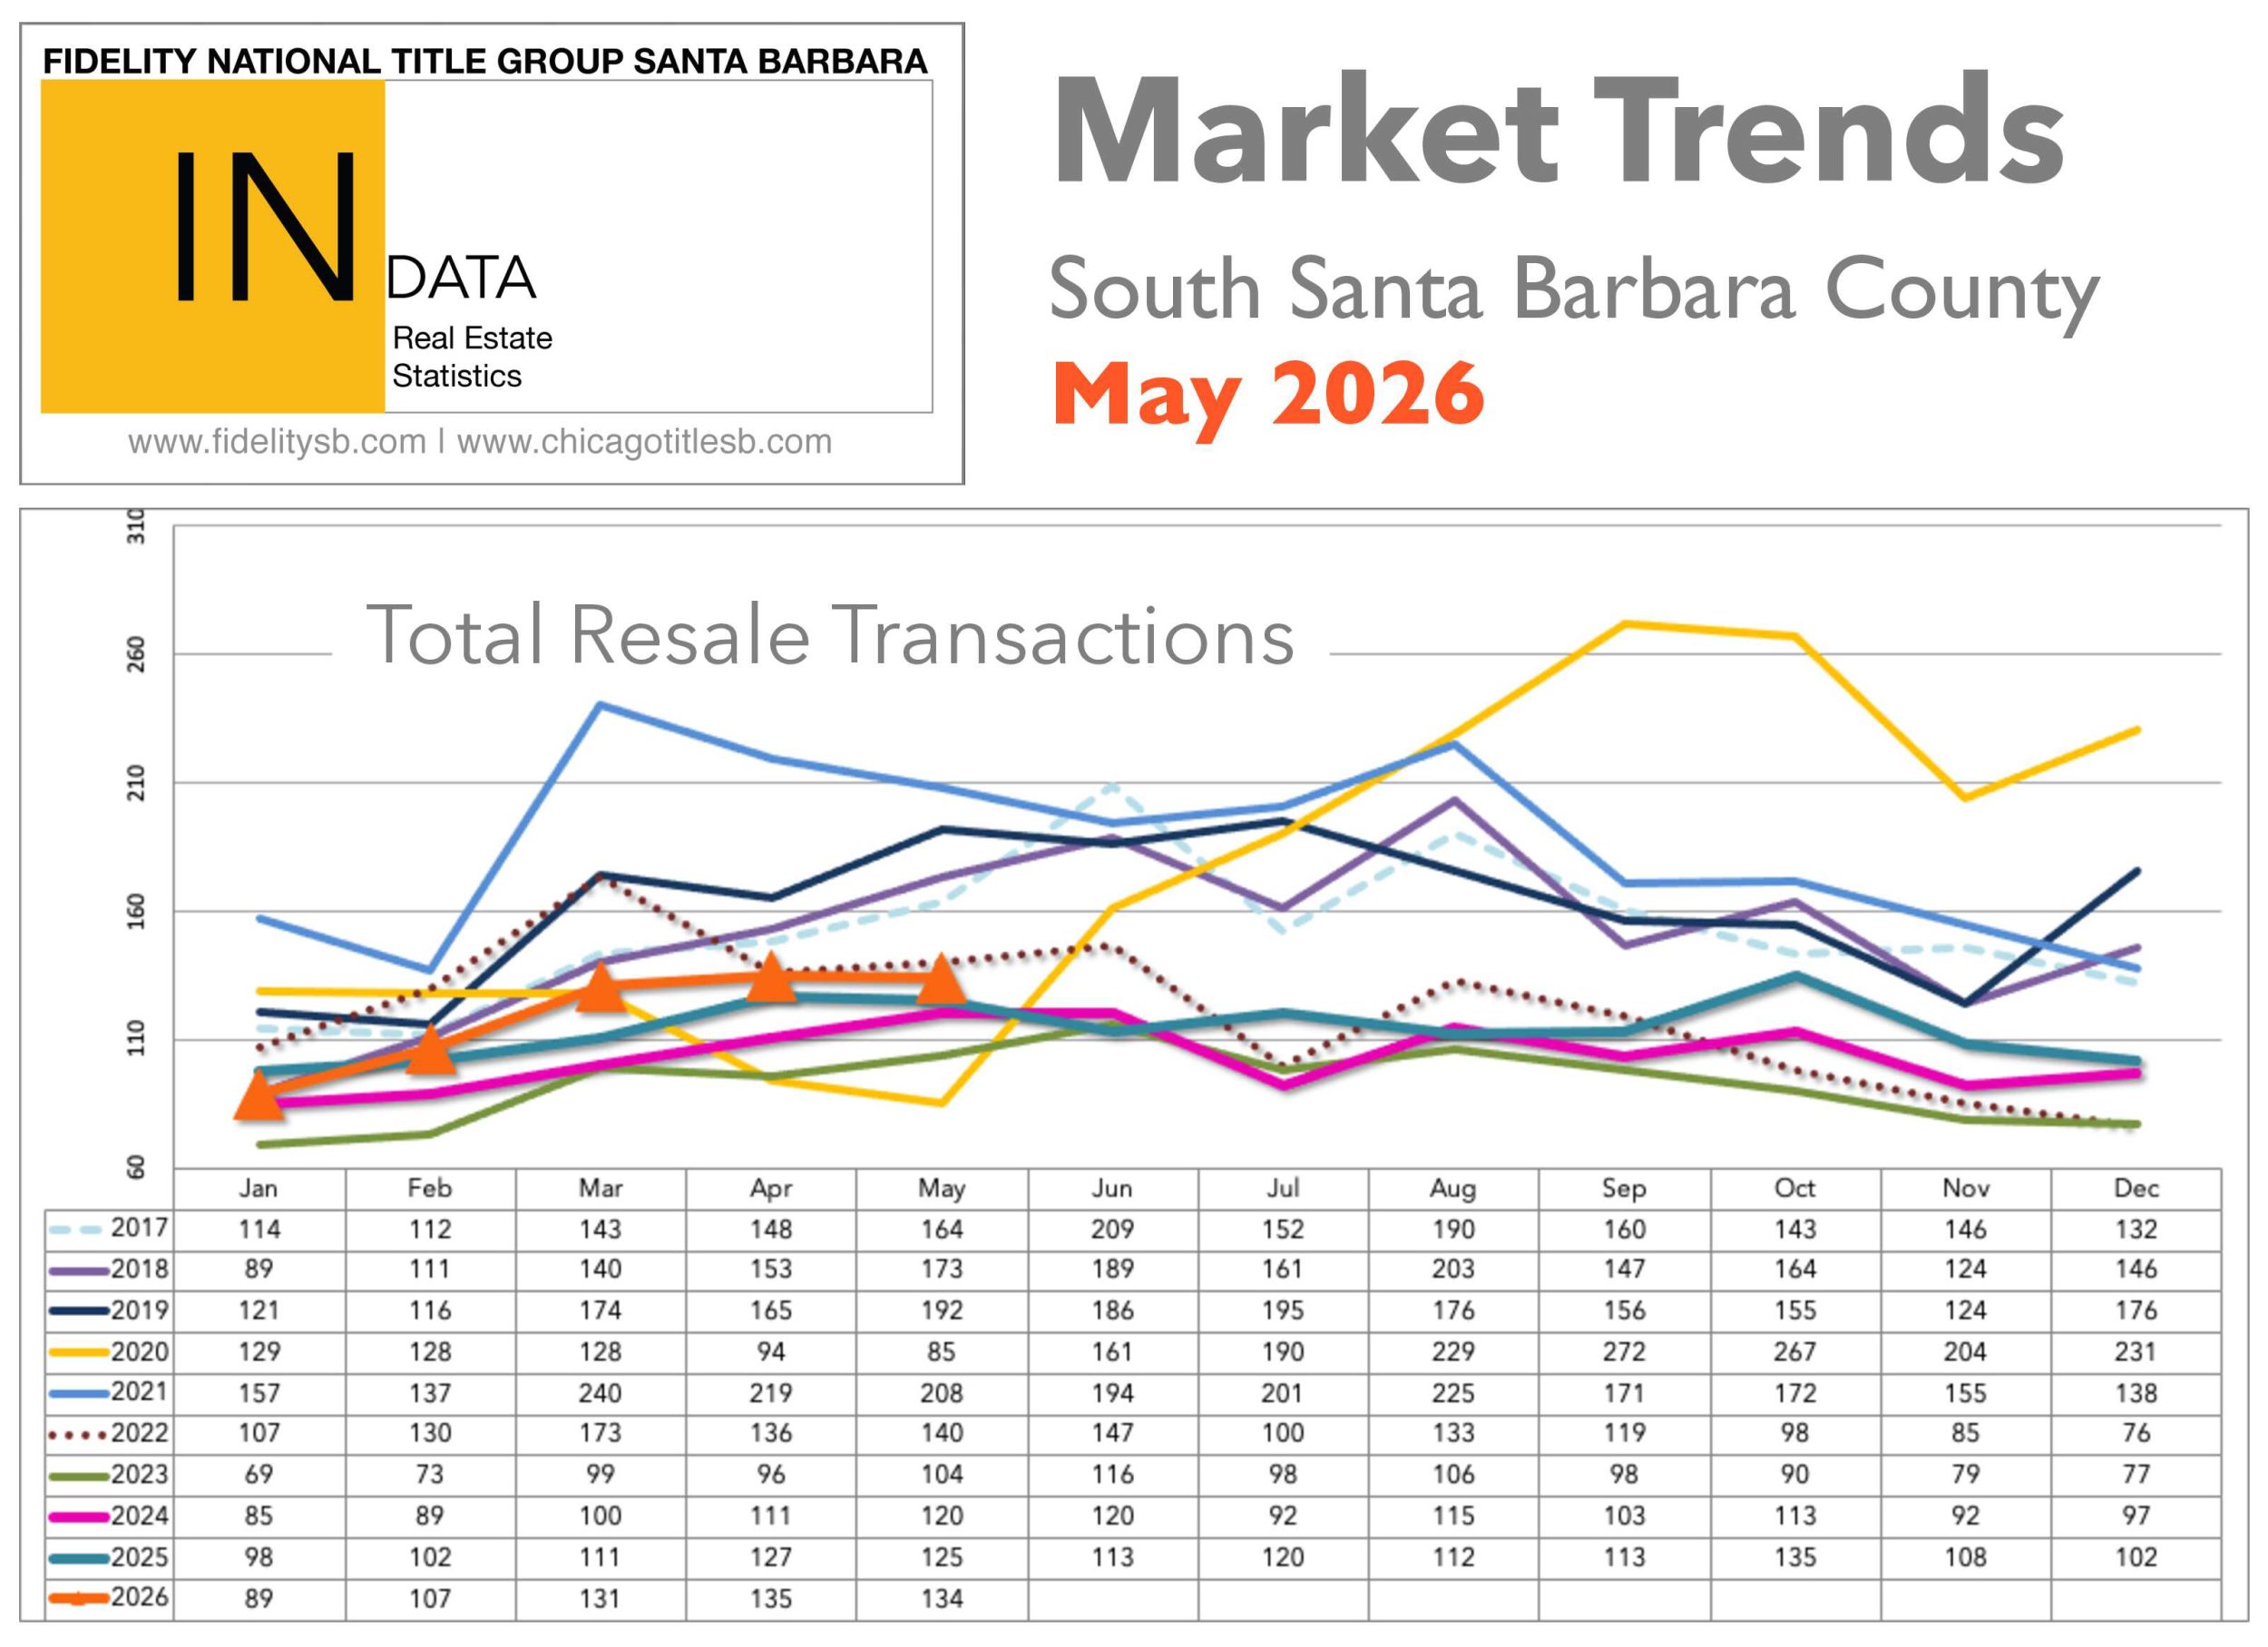
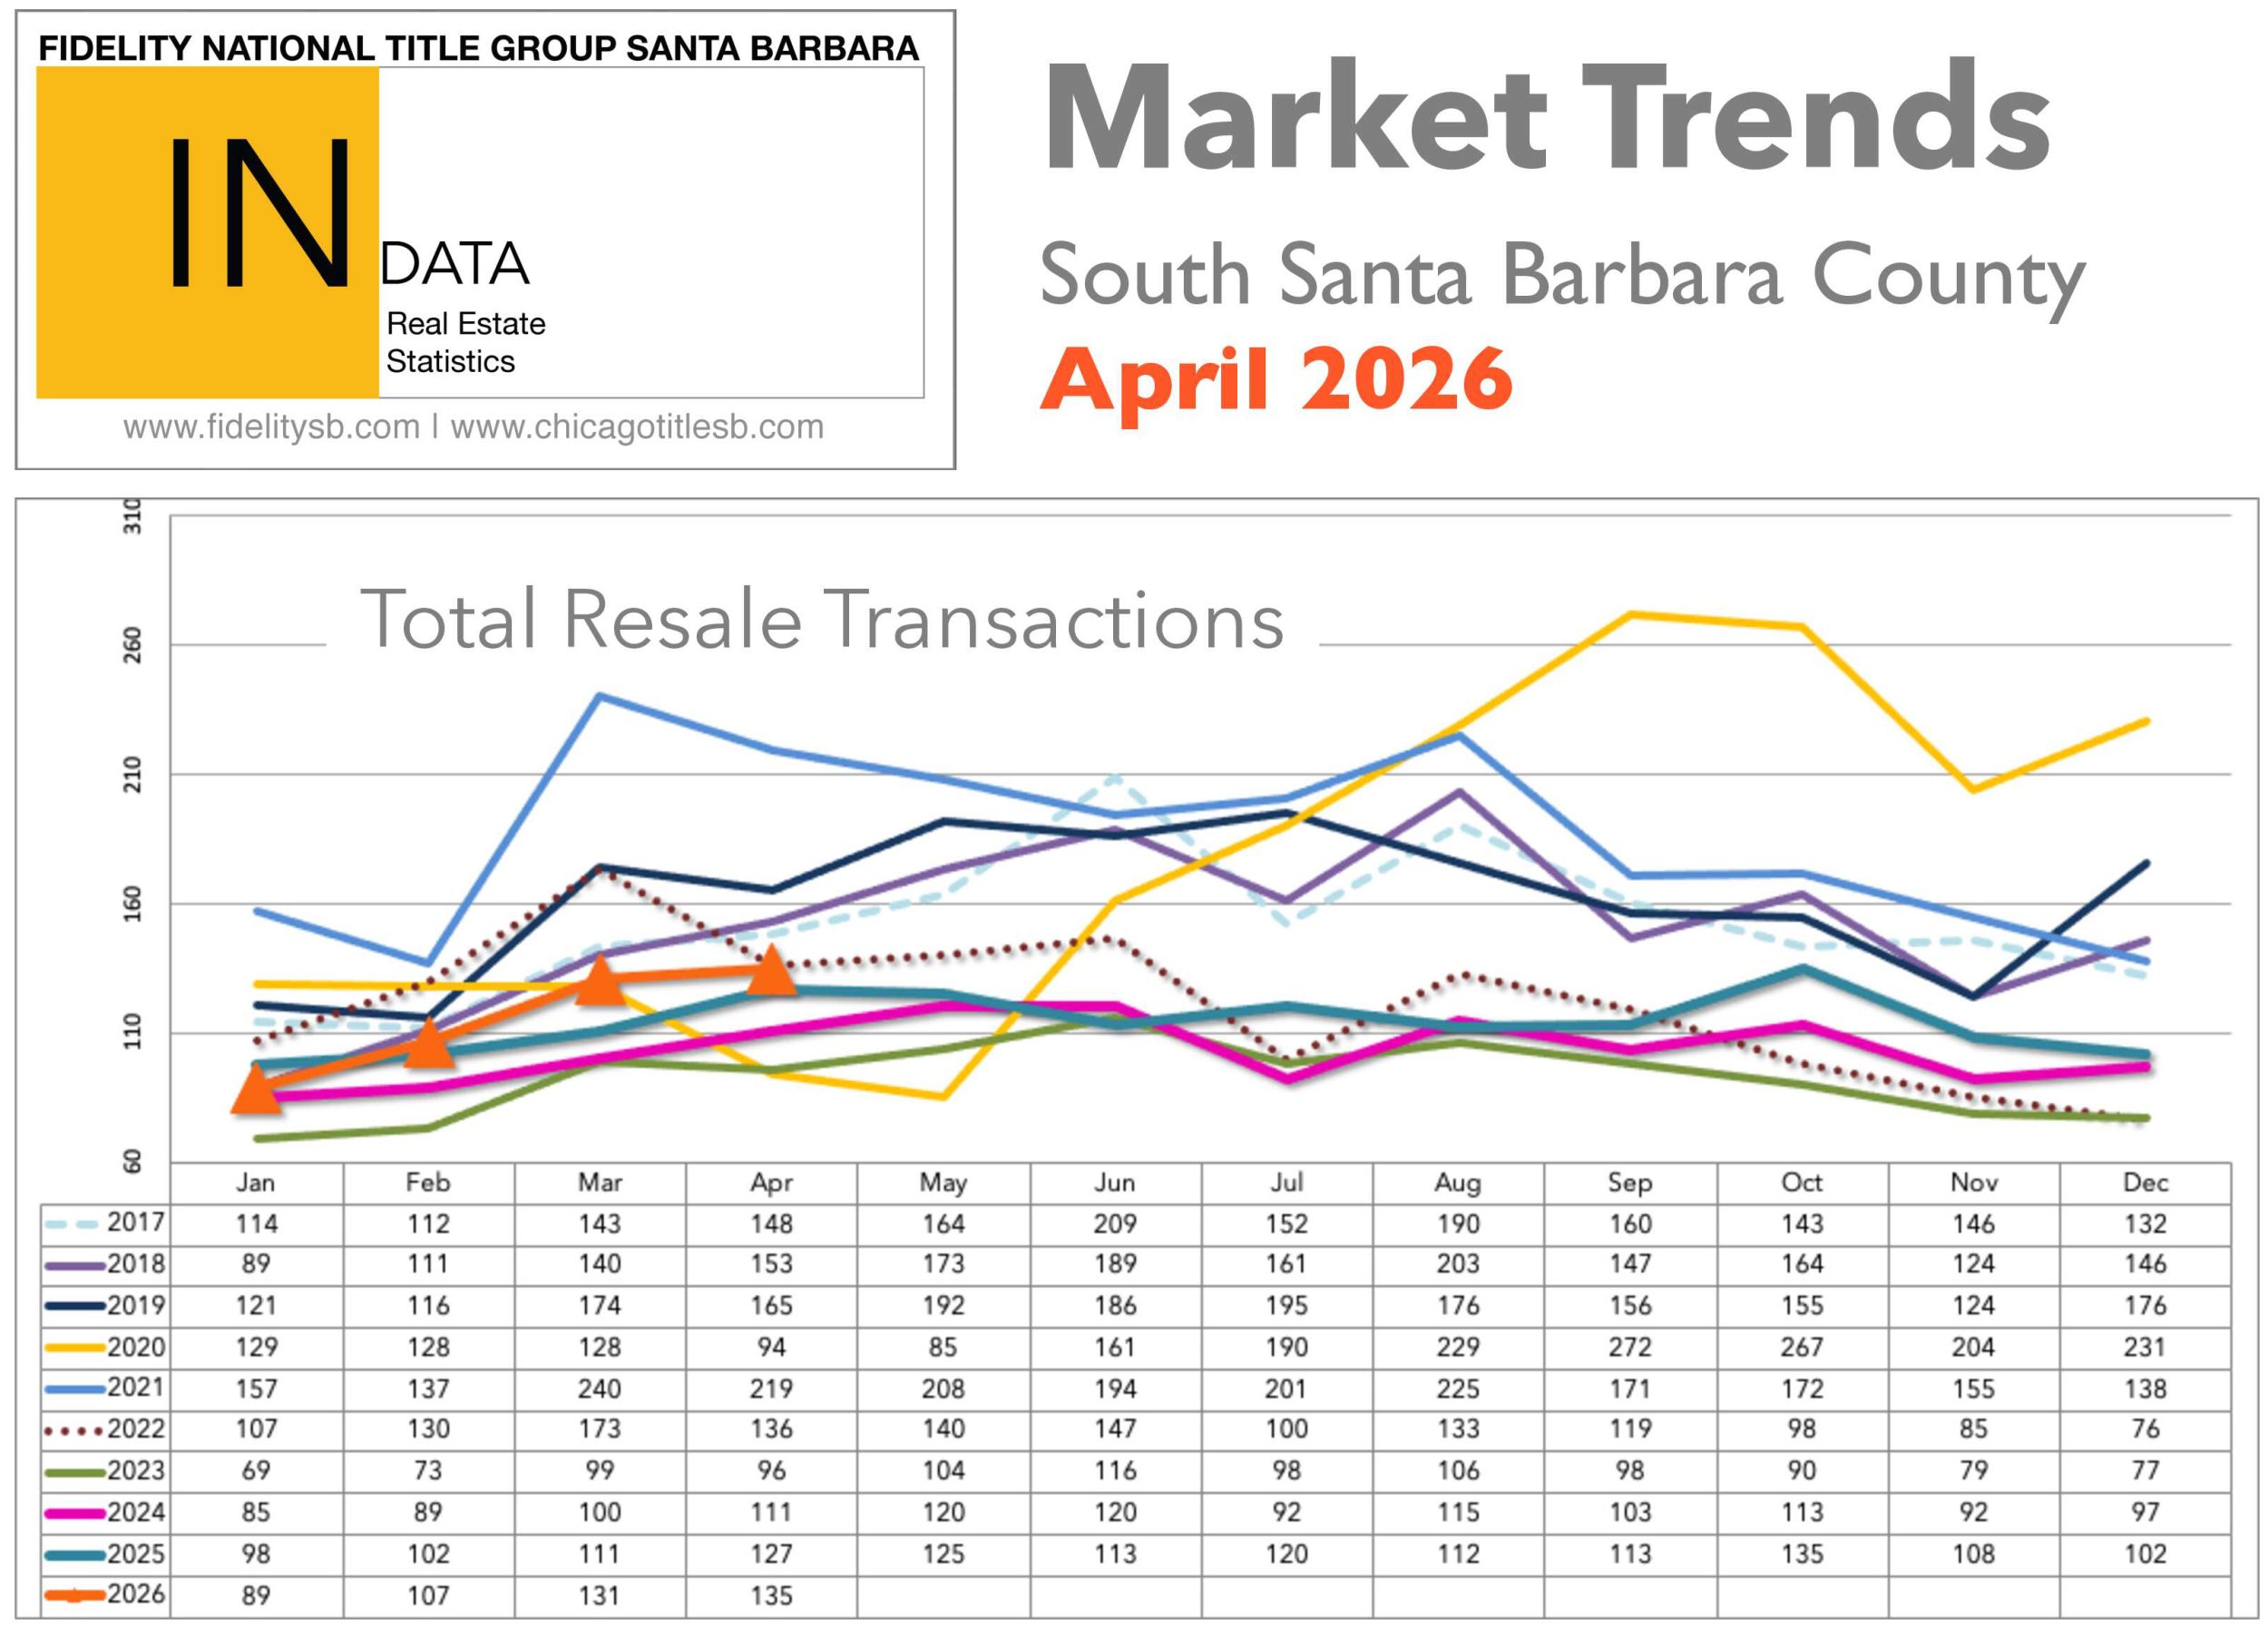
According to data from the County Recorder’s Office as reported by Fidelity National Title, the number of residential property sales on the Santa Barbara South Coast increased by 7% in May 2026, with 134 sales as compared with May 2025. Of these 134 sales, there were 100 House or Planned Unit Development (PUD) sales, up from 86 in May 2025; the median sale price of these House/PUD sales was $2,312,500, up 1% from 2025, and the average sale price was $3,360,386, up 7% from 2025. Of these 134 sales, there were 34 Condominium sales in May 2026, down from 39 in 2025; the median sale price of these Condominium sales was $1,049,500, down 9% from 2025, and the average sale price was $1,300,681, down 4% from 2025.
Regional Highlights
Carpinteria had 15 residential sales reported in May 2026, down from 17 in April. There were 8 House/PUD sales, the same number as in April; the median sale price of these House/PUD sales was $1,850,000, and the average price was $2,041,875. There were 7 Condominium sales, down from 9 in April; the median sale price of these Condominium sales was $950,000, and the average sale price was $979,857. In May 2026, the lowest-priced Carpinteria sale was a Condominium on Via Real @ $605,000, and the highest-priced sale was a House on 3rd Street @ $3,260,000.
Summerland had 1 residential sale reported in May 2026, down from 2 in April. The 1 PUD sale was on Freesia Drive and sold for $3,900,000.
Montecito had 17 residential sales reported in May 2026, down from 21 in April. There were 15 House/PUD sales, up from 14 in April; the median sale price of these House/PUD sales was $5,600,000, and the average price was $7,322,000. There were 2 Condominium sales, down from 7 in April; the median and average sale price of these Condominium sales was $4,466,000. In May 2026, the lowest-priced Montecito sale was a Condominium on Fairway Road @ $1,195,000, and the highest-priced sale was an Estate on Alston Road @ $15,900,000.
The City of Santa Barbara had 68 residential sales reported in May 2026, up from 59 in April. There were 51 House/PUD sales, up from 45 in April; the median sale price of these House/PUD sales was $2,160,000, and the average price was $2,700,742. There were 17 Condominium sales, up from 14 in April; the median sale price of these Condominium sales was $960,000, and the average sale price was $1,192,059. In May 2026, the lowest-priced Santa Barbara sale was a House on W. Ortega Street @ $612,500, and the highest-priced sale was a House on Roble Lane @ $5,770,000.
Hope Ranch had 2 residential sales reported in May 2026, down from 5 in April. There were 2 House/Estate sales, down from 5 in April; the median and average sale price of these House/Estate sales was $7,140,000. There are no Condominiums in Hope Ranch. In May 2026, the lowest-priced Hope Ranch sale was a House on Via Sinuosa @ $5,900,000, and the highest-priced sale was an Estate on Via Alegre @ $8,380,000.
Goleta had 31 residential sales reported in May 2026, the same number as in April. There were 23 House/PUD sales, up from 21 in April; the median sale price of these House/PUD sales was $1,750,000, and the average price was $2,345,903. There were 8 Condominium sales, down from 10 in April; the median sale price of these Condominium sales was $1,090,250, and the average sale price was $1,020,894. In May 2026, the lowest-priced Goleta sale was a Condominium on Hollister Avenue @ $770,000, and the highest-priced sale was a House on San Antonio Creek Road @ $5,773,000.
Analysis
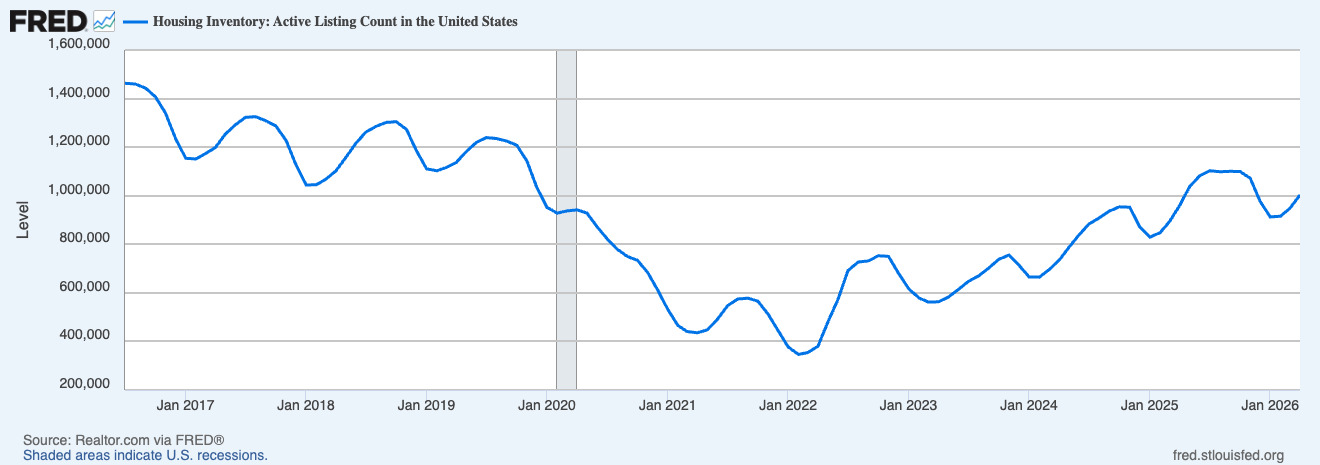
As of June 1st in the Santa Barbara Multiple Listing Service (MLS), there were 191 available House/PUD listings (down from 194 on May 1st) and 60 available Condominium listings (up from 56 on May 1st) along the Santa Barbara South Coast. The lack of housing inventory available for sale has loosened up a bit since last year, but it has continued to put upward pressure on housing values. Compare our current low supply levels to the years 2007 through 2011, when the total number of available listings that Buyers could choose from fluctuated between 734 and 1,026. Ten years ago in June 2017 there were 365 available House/PUD listings and 102 available Condominium listings available. The highest number of available listings along the Santa Barbara South Coast was recorded in June 1992, when there were an amazing 1,297 available!
While the number of days that listings stay on the market before entering escrow has risen and the competition among Buyers creating bidding wars has diminished a bit, it has not totally disappeared. According to the MLS sales data, there were a total of 130 residential sales in May on the South Coast of Santa Barbara County, up from 127 in April. The County Recorder reported 134 total sales in May, indicating that 4 private sales did not register in the MLS. Of the 130 MLS sales, 24% closed above the original asking price (down from 27% in April), 19% closed at the original asking price (down from 24% in April), and 57% closed for less than the original asking price (up from 49% in April). After analyzing the April MLS sales data, there were 7 listings (down from 16 in April) which sold $100,000+ above their original asking prices; these listings were Knoll Circle Drive which sold $495,000 above asking, Arbol Verde Street which sold $305,000 above asking, Meadowlark Lane which sold $255,000 above asking, Santa Rosa Lane which sold $205,000 above asking, Green Lane which sold $200,000 above asking, Los Feliz Drive which sold $165,000 above asking, and Vincente Way which sold $150,000 above asking. Nationally, the percentage of May sales above the asking price has averaged 28% as compared to the South Coast of Santa Barbara’s 24%. If you think Buyer competition is high in Santa Barbara, think again: Compass in the Silicon Valley reports that in May at least 41 properties sold for $200,000 or more above list price, including 18 homes that commanded premiums of $400,000 or higher. Even more impressive, 7 properties closed for more than $700,000 above asking. One standout home in Palo Alto attracted 20 offers and ultimately sold for an astounding $1,405,000 over its list price!
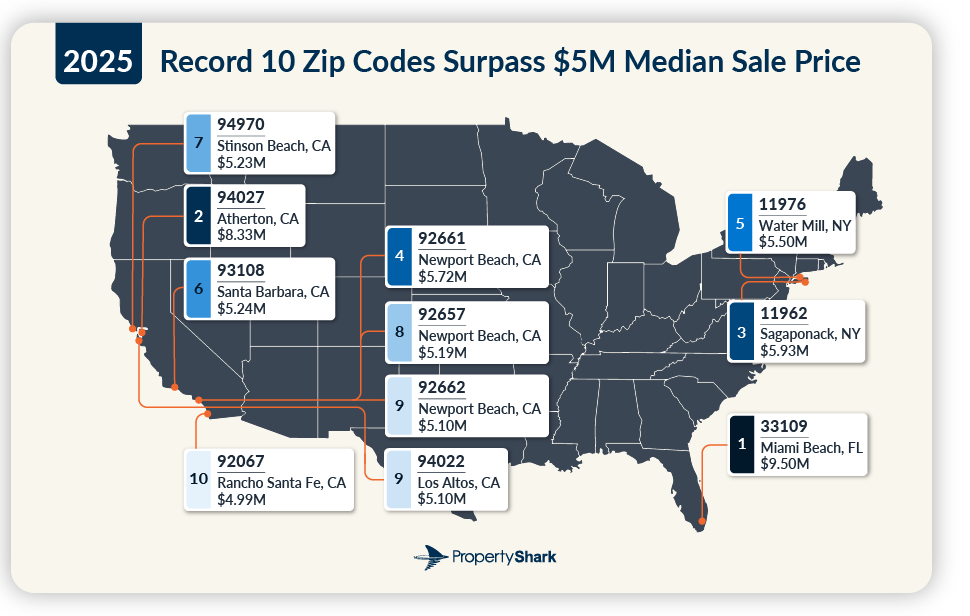
Of the 134 residential sales in May 2026, 117 sold over $1,000,000, which equates to 87% of the total sales, up from 80% April. As a comparison, just 12% of listings nationwide are priced above $1,000,000. The South Coast of Santa Barbara County is not an inexpensive place to purchase real estate compared to other areas of the United States, but many people will pay more to live in Santa Barbara. According to Property Shark’s survey, California had 7 of the 10 most expensive median-priced ZIP codes in the United States. Montecito’s 93108 ZIP code came in at #5 with a median sale price of $6,995,000. The #1 spot is held by Fisher Island (off the coast of Miami) where the median sale price is $11,925,000, which is 27 times higher than the U.S. median sale price. https://www.propertyshark.com/Real-Estate-Reports/most-expensive-zip-codes-in-the-us/
Another validation of Santa Barbara’s popularity, no matter the cost, the New York Post’s survey ranked the most expensive cities in the US to visit as a tourist and the winner is #1 Aspen where a three-day trip for two costs $2,708. Closely followed is #2 Santa Barbara where a three-day trip for two costs $2,446. Filling out the top five on the list were Anchorage, Bar Harbor, and Fairbanks. The last (#55) on the list and the least expensive tourist destination for vacationers was Clearwater, Florida, where a three-day trip for two costs $1,630, 40% less than Aspen. https://nypost.com/2025/07/04/lifestyle/most-expensive-tourist-destinations-in-the-us-in-2025/
Another reason Santa Barbara is so sought after is its local educational system as University of California Santa Barbara ranked as #91 out of 2,250 universities worldwide, and Santa Barbara City College ranked #1 out of the 116 Community Colleges in California.
https://www.usnews.com/education/best-global-universities/rankings and
https://bold.org/blog/best-community-colleges-in-california
The next Federal Reserve’s Open Market Committee meeting is set for June 16-17, and prediction markets are speculating when the Fed might hike its rates. Former Fed Chair Jerome Powell’s tenure ended on May 15, but as a Fed Governor, he maintains a voice on monetary policy and the potential challenges the central bank faces with an aggressive President Trump trying to exert his influence. Even with Trump’s pick, Kevin Warsh, sworn in, the president’s history suggests that the honeymoon will be short if Warsh displeases him in any way. And by “displeasing” him, that means not doing exactly what Trump wants. A rate hike would fall neatly into that category. When Powell received the 2026 John F. Kennedy Profile in Courage Award, he spoke of his concerns about the bank’s independence and how Trump’s persistent aggression threatens it, calling it a “stress test.” https://federalnewsnetwork.com/prediction-markets/2026/06/powell-issues-warning-trump-stress-test-see-odds-next-fed-rate-hike/
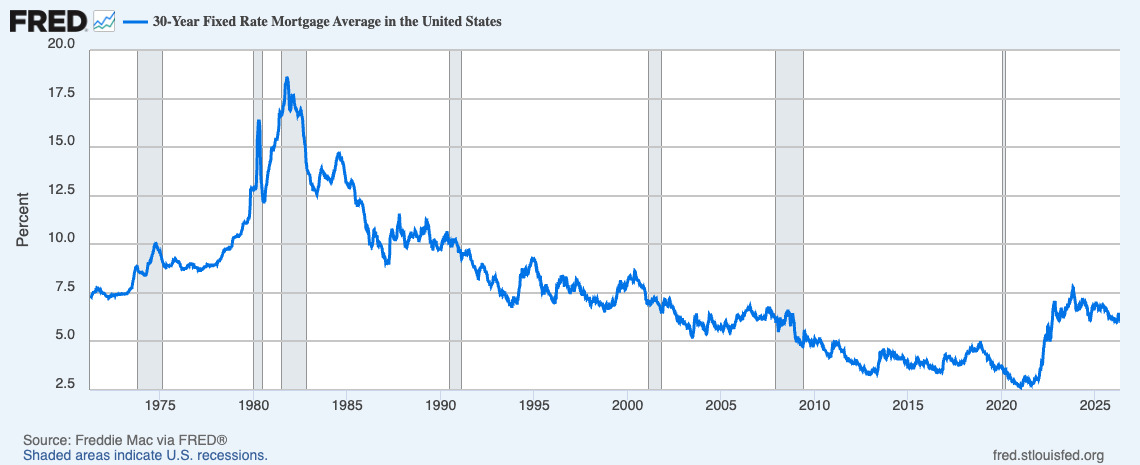
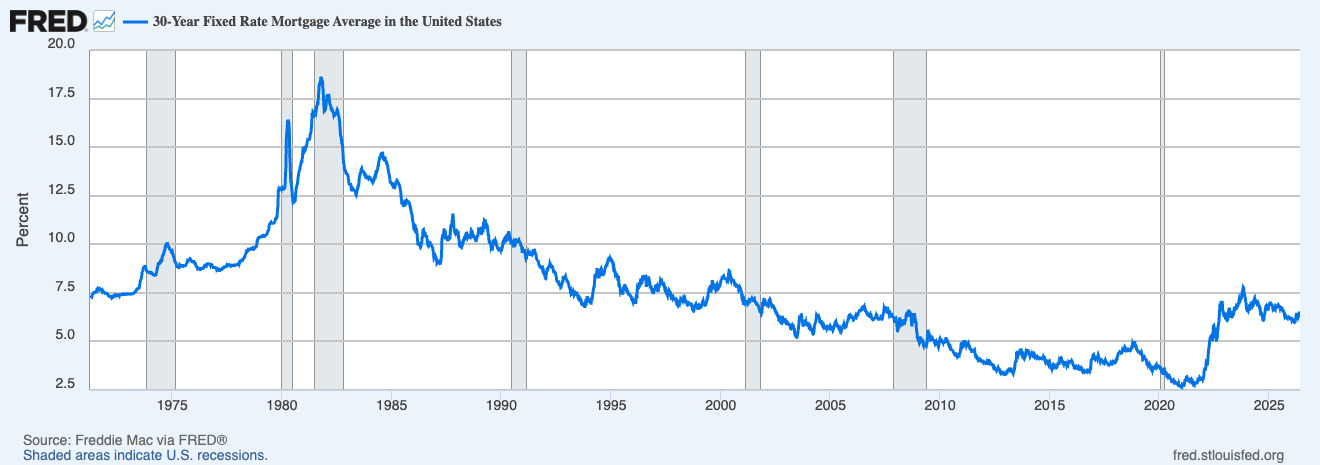
Since the beginning of 2022, 30-year mortgage interest rates have doubled, but started easing downward in 2024, and were 6.53% as of May 28th, up from 6.3% on May 1st. Historically, the lowest 30-year mortgage interest rate since 1970 was recorded in February 2021 at 2.65% and that low rate was matched in July 2021 during the COVID pandemic. If Buyers are expecting 3% or even low 5% mortgage rates to return to buy a home, they are waiting for an anomaly and should wait no longer. The highest historical 30-year fixed-rate interest rate was recorded in 1981 @ 18.63%. The average 30-year mortgage rate over the last 50 years has been 7.70%, so current rates are still below that average. Mortgage rates of 8.03% in October 2023 were at a 23-year high following all-time lows reached just three years before, highlighting the effect that financing costs have on the housing market. The payment on a $913,100 mortgage in 1981 would have been $13,423/month, the payment in June 2021 would have been $3,679/month, and as of June 1st, the payment would be $5,789/month. As an alternative to obtaining a mortgage, in May 2026, 48% of South Coast Buyers purchased homes with cash, up from 40% in April.

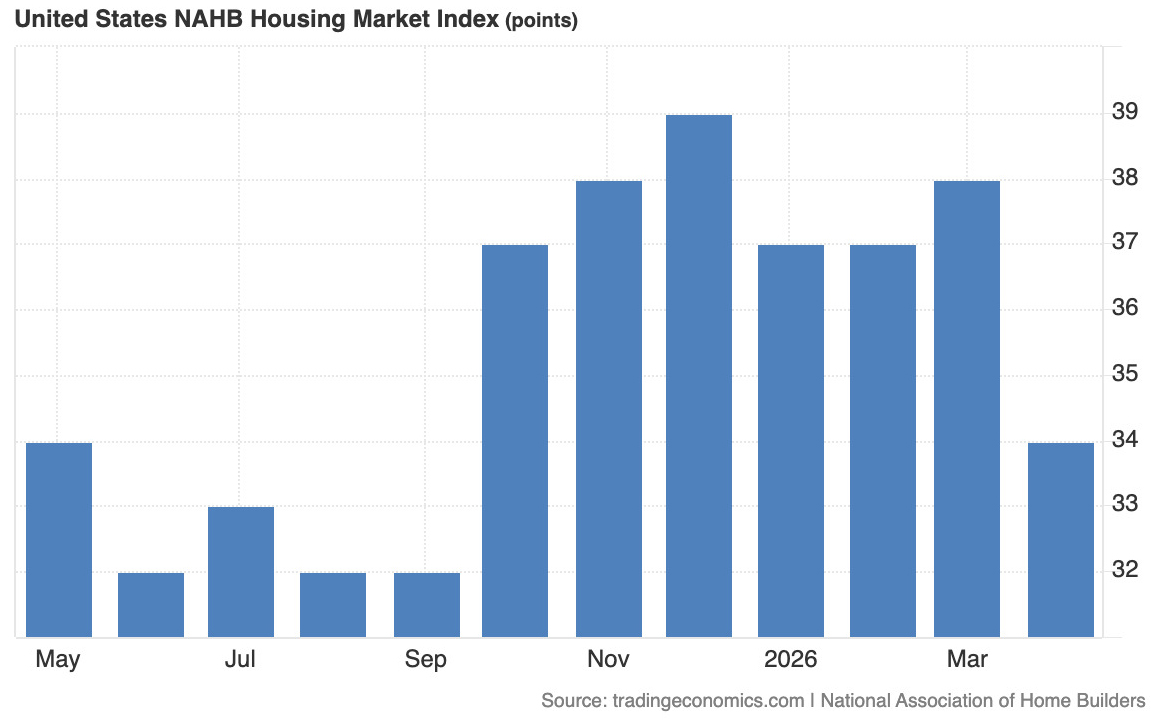
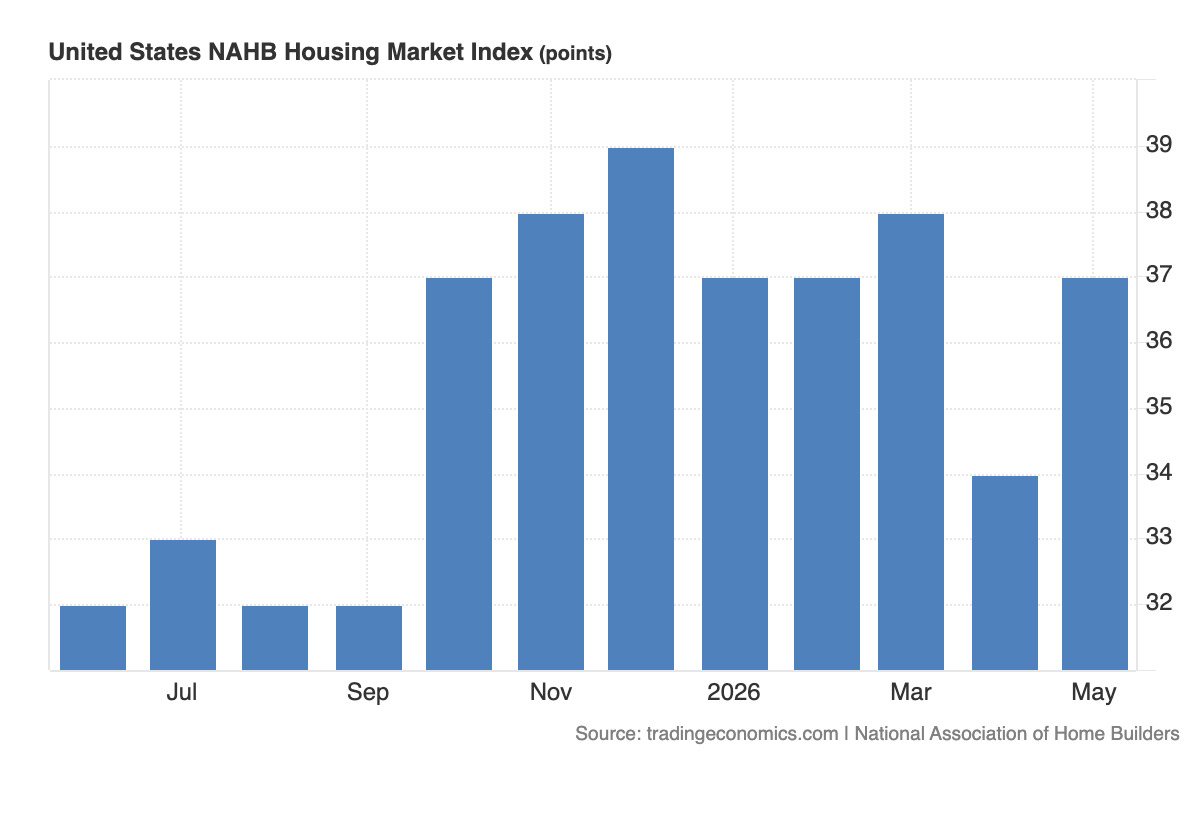
The NAHB/Wells Fargo Housing Market Index in the US, which measures builder confidence in the market for newly built single-family homes, rose to 37 in May 2026 up from 34 in April which was its lowest level since September 2025, and came in above forecasts of 35. The current sales conditions rose three points to 40. Sales expectations in the next six months increased three points to 45 and traffic of prospective buyers posted a three-point gain to 25. Also, 32% of builders cut prices in May, down from 36% in April. The average price reduction was 6%, up from the 5% figure in April. https://www.nahb.org/news-and-economics/housing-economics/indices/housing-market-index
As for the worldwide cost of living as of June 1st, Expatistan compiled an index of 103 major worldwide metropolitan areas. According to the index in the United States the most expensive metropolitan area to live in is #1 New York City (which is also the most expensive in the world) with a @ 244 Price Index score (according to GasBuddy the least expensive gallon of regular gas costs $4.59/gallon in New York). The least expensive City in the United States is Cedar Rapids, Iowa @ 82 ($3.95/gallon). The lowest State average gas price in the United States is $3.96/gallon in Oklahoma. Of the top 25 most expensive areas on the worldwide list, two are in California: #8 San Diego @ 174 ($5.29/gallon) and #9 Los Angeles @ 173 ($6.07). According to the index, the least expensive area to live in the world is #103 Yogyakarta (Indonesia) @ 30 ($2.52/gallon – government subsidized). Gas prices on the South Coast are as low as $5.53/gallon (up $1.00++ from February) and are generally lower than in other California coastal areas. A Chevron Station near LAX is now charging $8.71/gallon! According to AAA in California, the most expensive average cost of gas is in Mono County @ $7.05/gallon and the least expensive is in Modoc County @ $5.68/gallon. According to AAA, the average cost of a gallon of gas in California is $6.03/gallon, while the National average is $4.32/gallon. The most expensive gas in California is sold in Gorda By The Sea on the Big Sur Coast where a gallon of gas will set you back $9.99. If you think that we have high prices, you may be surprised that in Hong Kong gas costs $15.75/gallon! Expatistan’s Cost of Living Index is an interesting way to compare the cost of living in cities around the world. https://www.expatistan.com/cost-of-living/index
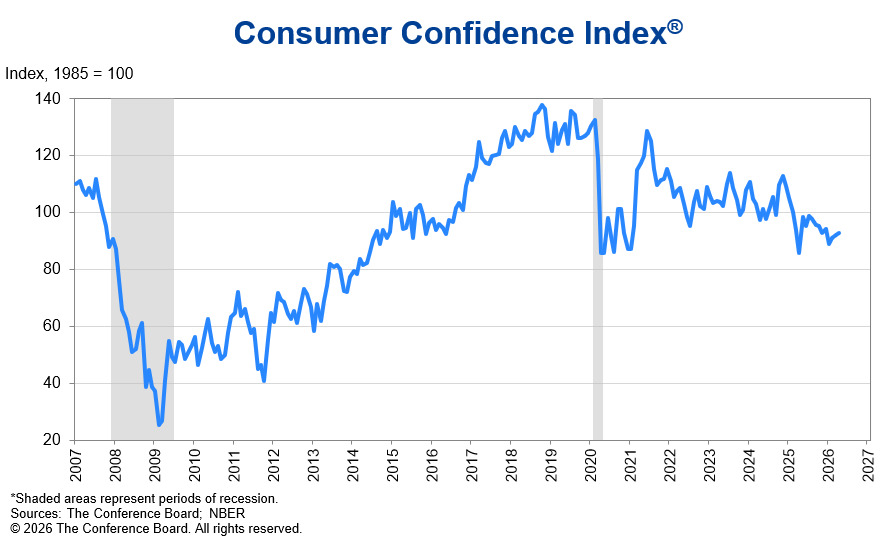
On May 26th the Conference Board Consumer Confidence Index® dipped 0.7 points to 93.1 (1985=100), down from an upwardly revised 93.8 in April. The survey period for this month’s preliminary results was May 1–19, noting the ongoing war in the Middle East that is placing upward pressure on prices globally. “Consumer confidence edged downward in May as the inflationary impacts of the war in the Middle East intensified,” said Dana Peterson, Chief Economist, The Conference Board. “Consumer appraisals of current business conditions and the current labor market were moderately less positive compared to last month. This was somewhat offset by modest improvements in consumers’ expectations for business conditions and the labor market six months from now. Meanwhile, income expectations eased in May, as those anticipating less income rose.” https://www.conference-board.org/topics/consumer-confidence

According to the University of Michigan’s monthly survey, consumer sentiment fell in May for the third straight month as supply disruptions in the Strait of Hormuz continue to boost gasoline prices. Sentiment is now just below the previous historical trough seen in June 2022. The cost of living continues to be a first-order concern, with 57% of consumers spontaneously mentioning that high prices were eroding their personal finances, up from 50% last month. https://www.sca.isr.umich.edu/

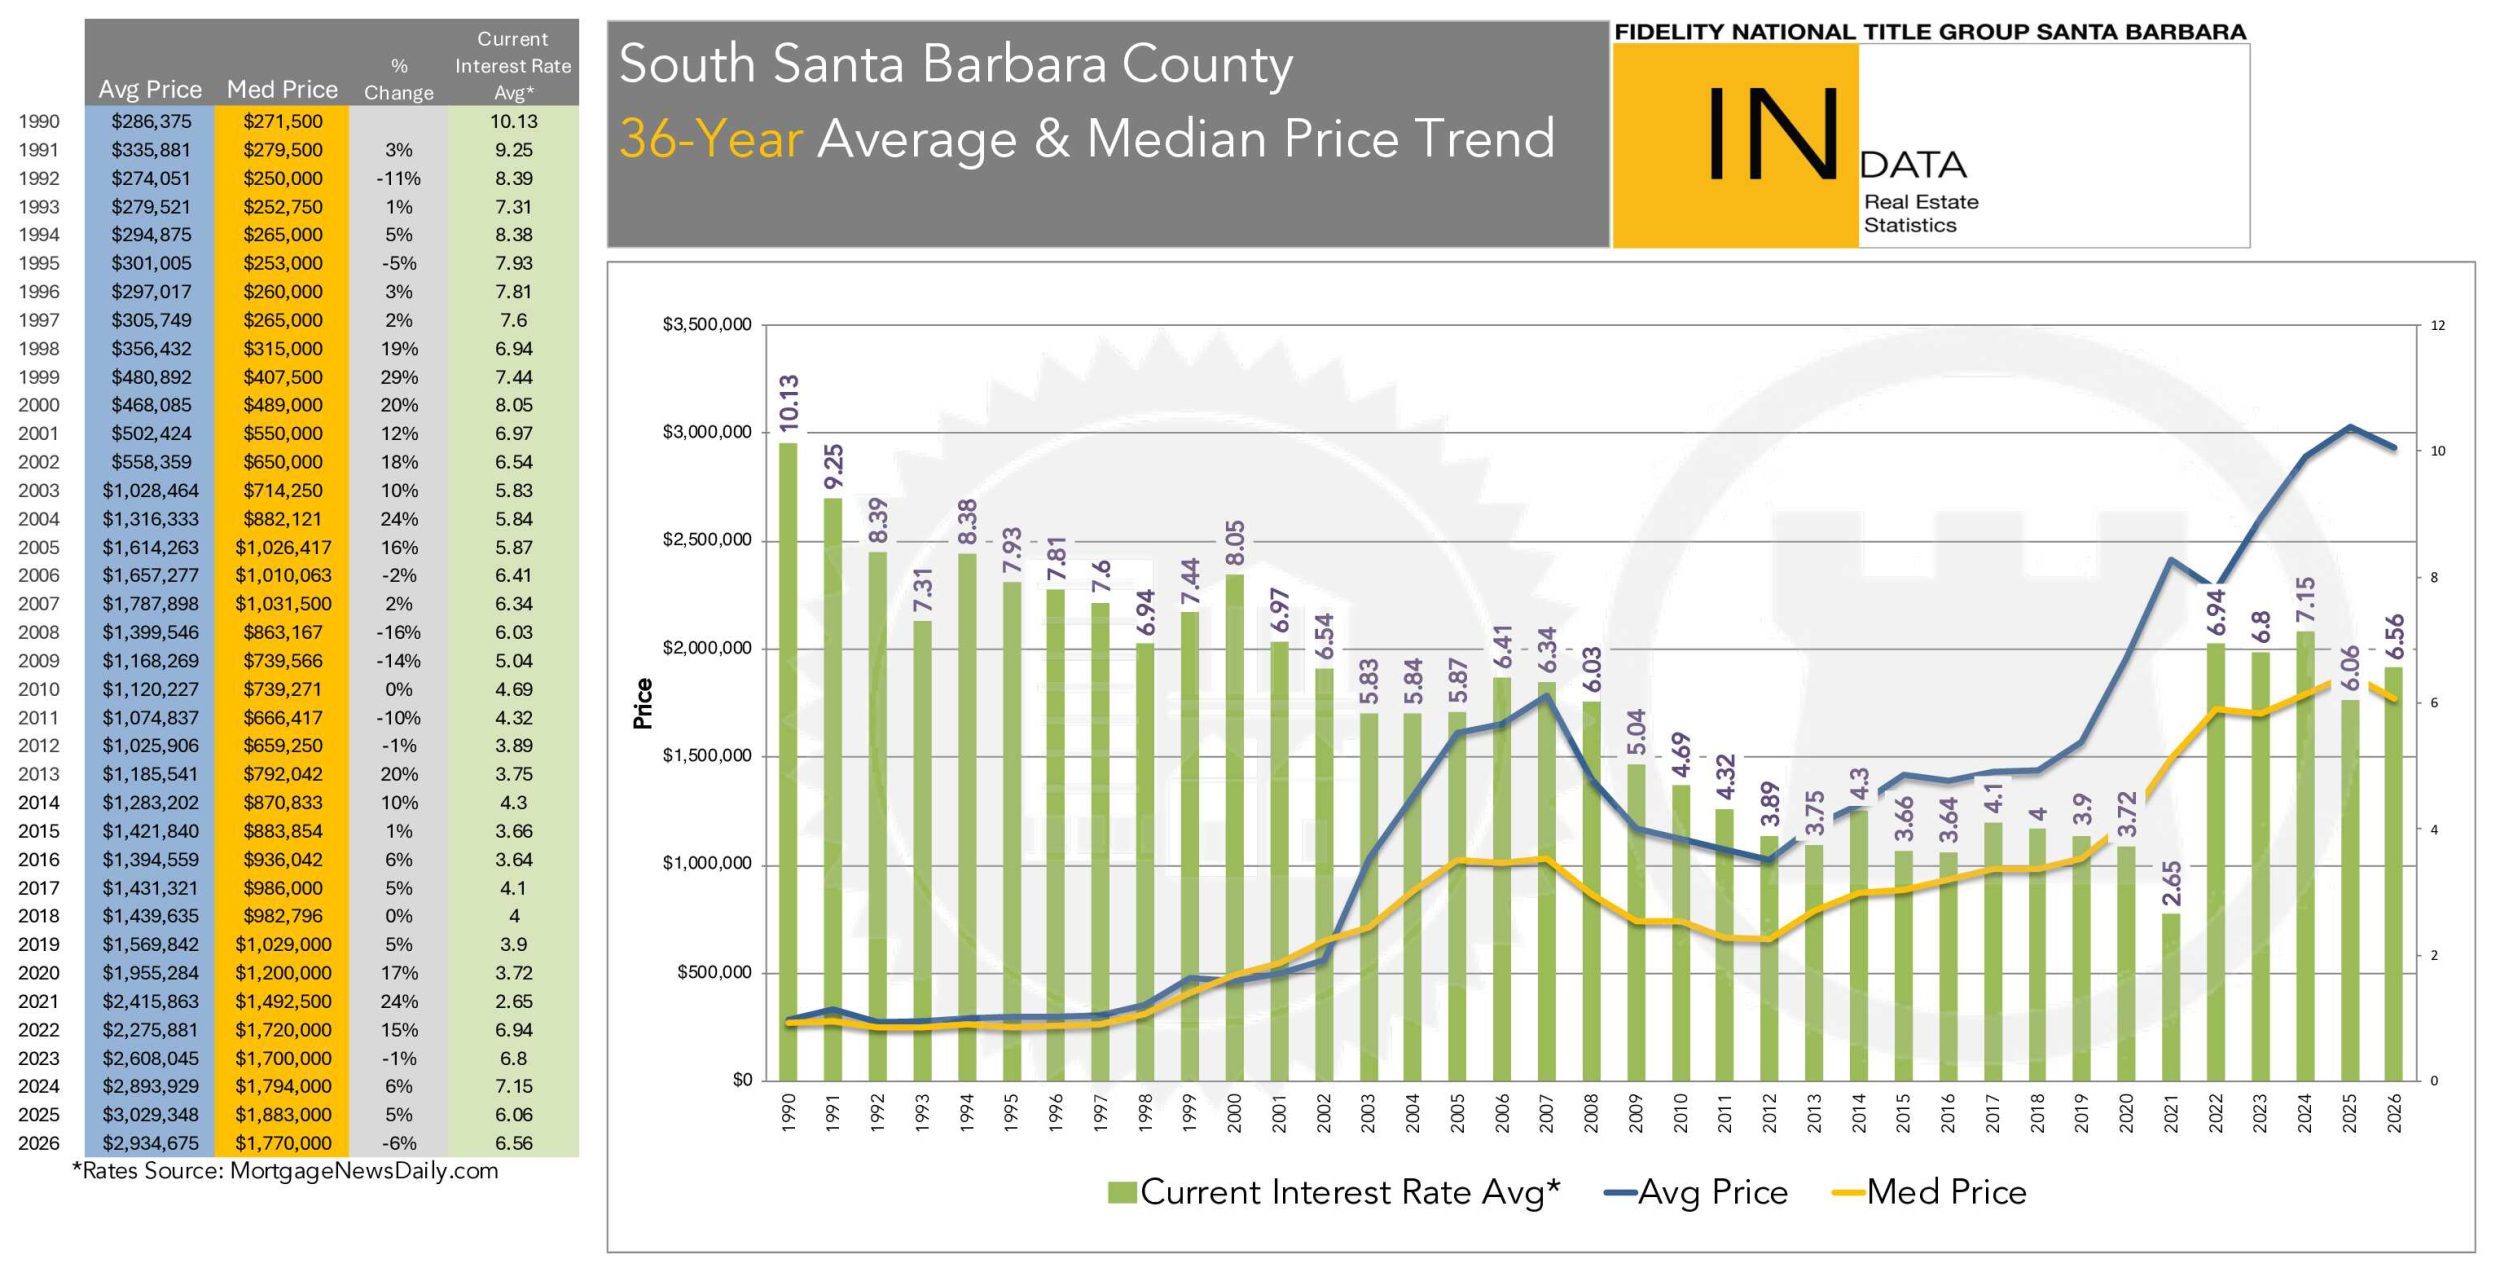
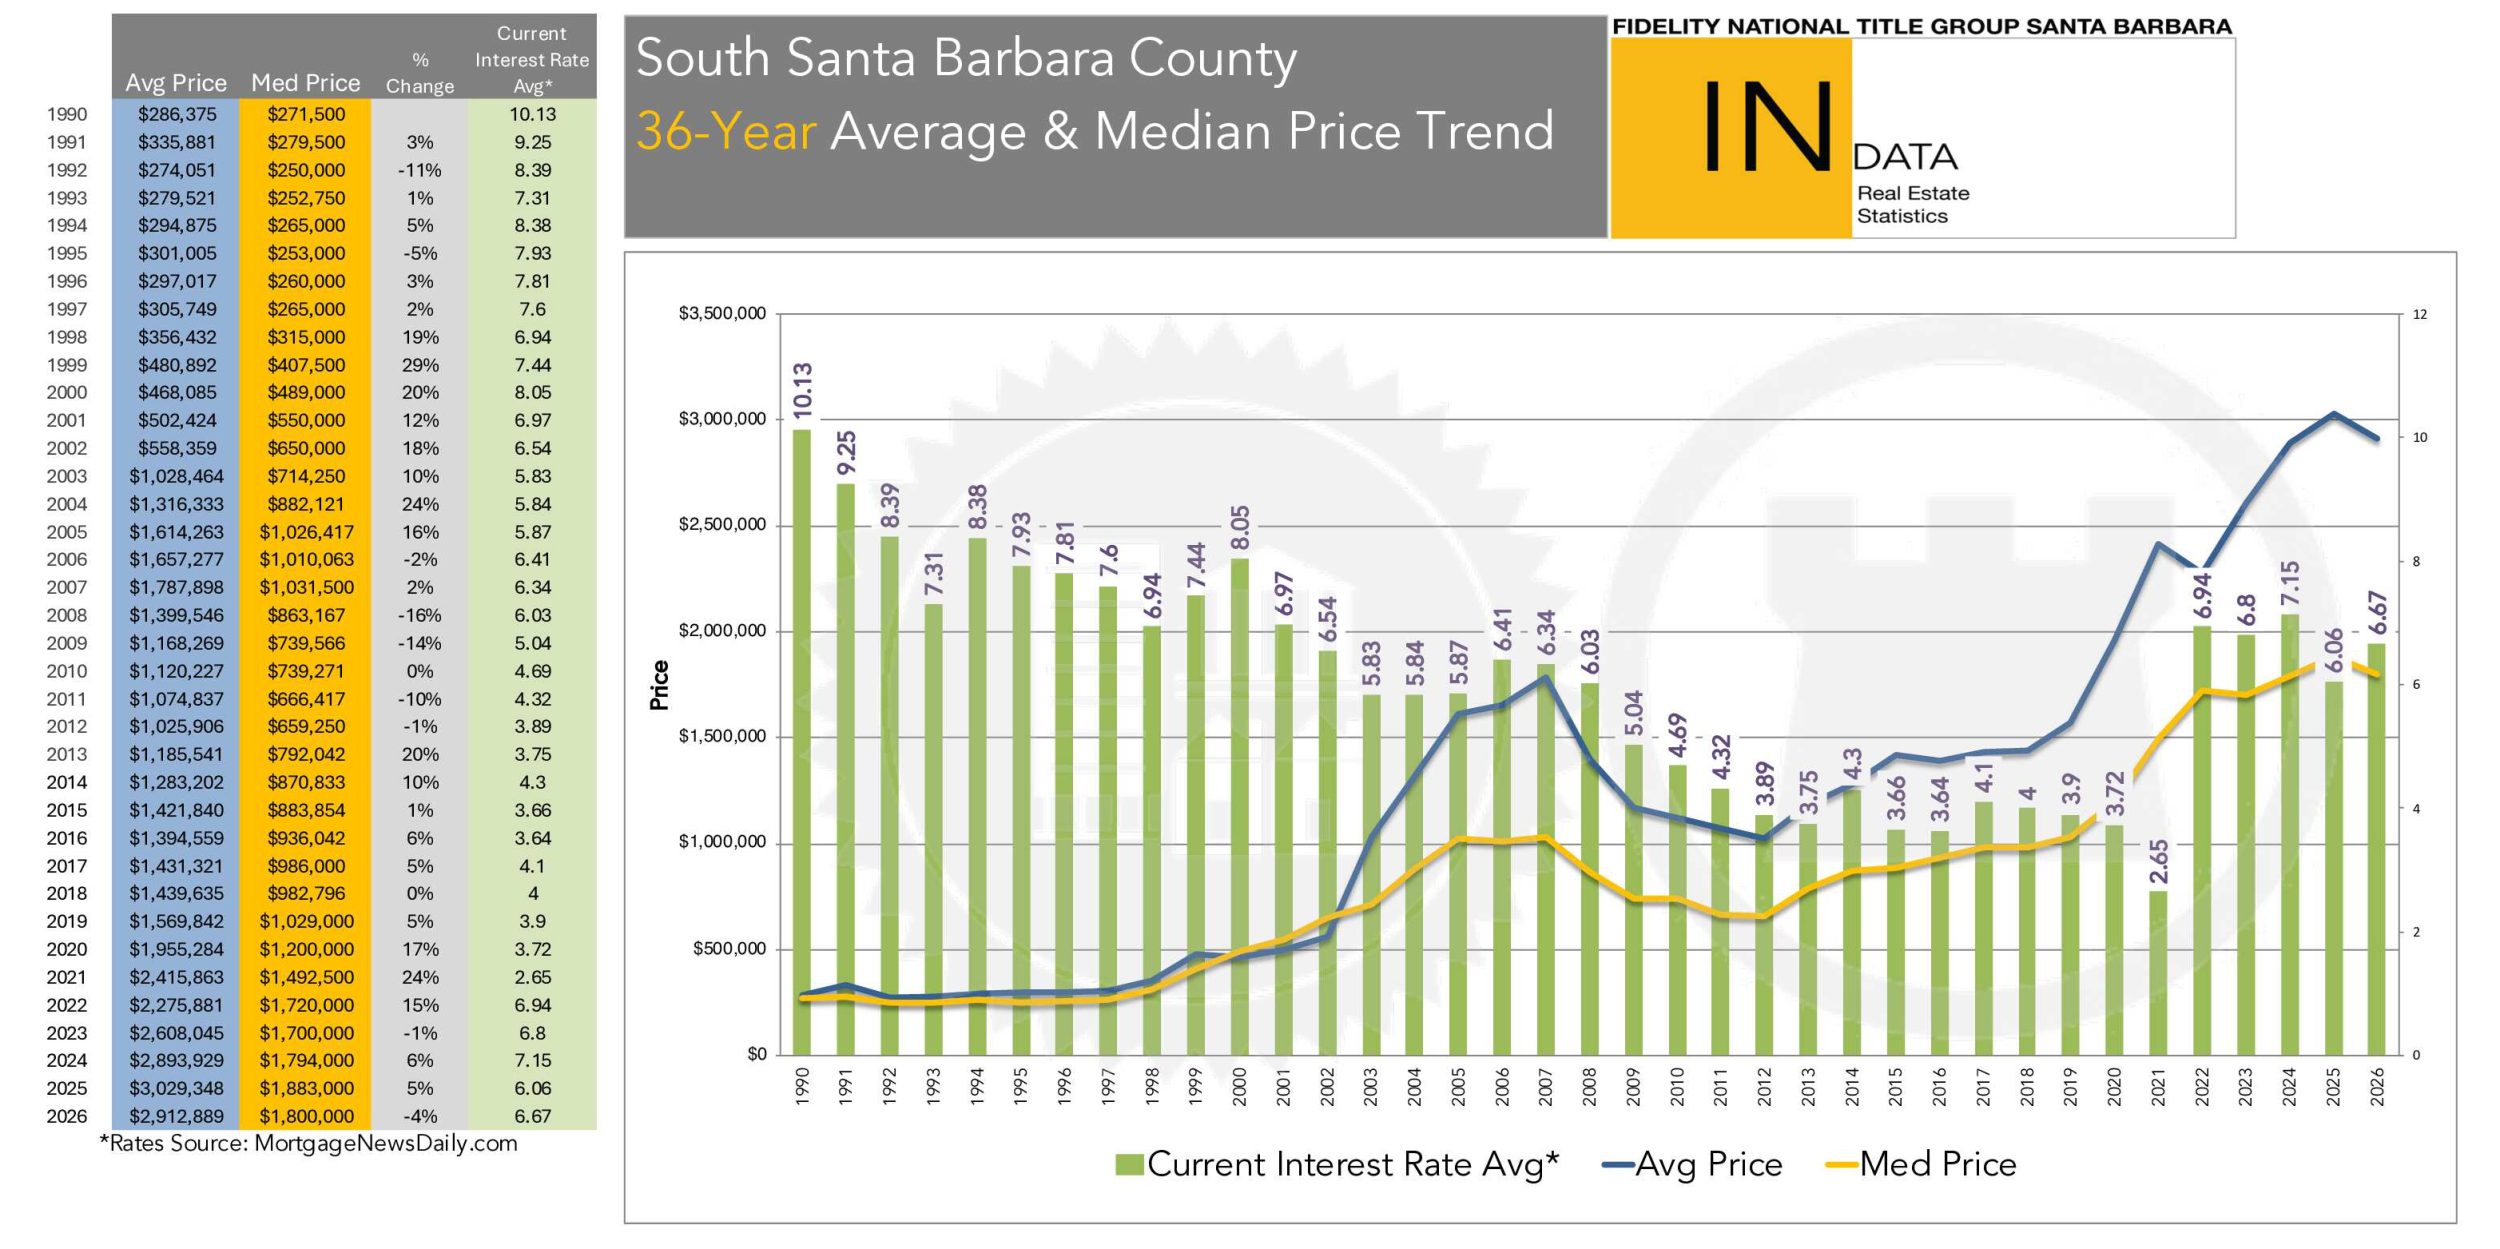
Historically, the highest Year-to-Date median sale price on the Santa Barbara South Coast was recorded in 2007 at $1,031,500, but that high mark is now ancient history. The median sale price of all residential 2026 sales Year-To-Date as of May 1st was $1,800,000, down 4% from 2025, and the average sales price was $2,912,889. While the median sale price was hovering near 2007’s historic high for most of 2017, 2018, and 2019, it started its upward climb in 2020, accelerating in 2021 and into the first half of 2022 before leveling off throughout and declining 1% in 2023. There have been no double-digit price increases in the median sales price since a 17% increase in 2020, 24% in 2021 and 15% in 2022.
Based on the Santa Barbara Multiple Listing Service data, as of June 1st in the City of Santa Barbara, there were 72 active House/PUD listings (down from 79 on May 1st) and 36 pending sales (down from 40 on May 1st) which equates to a 2-month supply (up from 1.5 on May 1st) of listings for Buyers to choose from in the City of Santa Barbara. Generally, a 1-month supply would indicate the listings would be sold within one month. A less than 1-month supply of inventory indicates a feverish Seller’s market, a 1-to-2-month supply indicates a heated Seller’s market, and a 2-to-4-month supply is considered a basic Seller’s market where Buyer demand is still high, and inventory is scarce. Historically, a 4-to-6-month supply of available inventory indicates a Balanced market. More than a 6-month supply indicates a Buyer’s market where inventory is plentiful, with Buyers being slower to make decisions as they compare numerous properties on the market. As of June 1st, Carpinteria/Summerland has a 1.5-month supply (down from 2.3 on May 1st), Montecito has a 6.4-month supply (up from 4.6 on May 1st), Hope Ranch has a 3.3-month supply (down from 5.7 on May 1st), and Goleta has a 1.6-month supply (up from 1.1 on May 1st). Carpinteria/Summerland and Goleta are both in a heated Seller’s market. Montecito is in a Buyer’s market. Santa Barbara and Hope Ranch are both in a basic Seller’s market. With a combined total of 83 House/PUD pending sales (down from 86 on May 1st) and 191 active listings (down from 194 on May 1st) along the South Coast of Santa Barbara County, there is a 2.3-month supply (the same number as on May 1st) of House/PUD listings from which Buyers can choose. By removing the 64 higher-valued House/PUD listings in Montecito & Hope Ranch and their 12 pending sales from the equation, there is only a 1.8-month supply (basically the same number as on May 1st) from which Buyers can choose on the South Coast of Santa Barbara County. With a combined total of 21 Condominium pending sales (down from 28 on May 1st) and 60 active listings (up from 56 on May 1st), there is a 2.9-month supply (up from 2 on May 1st) of Condominium listings from which Buyers can choose.
There are many concerns for Buyers and Sellers. These include the wars in the Middle East and Ukraine, the rising price of gas, continued worldwide geopolitical tensions, inflation, insurance premium volatility, mortgage interest rates, health insurance rates, geopolitical tensions, and how many other administration economic policies are confusing to our trading partners. Also, a major concern for Buyers and Sellers is the scarcity and cost of homeowners’ insurance coverage, especially since State Farm, Nationwide, Kemper, Marine America, Trans-Pacific, Allstate and others have refused to issue new policies in California and are not renewing existing home insurance policies. Buyers are increasingly resorting to the California Fair Plan for insurance coverage as the last resort, whose rates are rumored to be rising by 29% later this year. Sellers should be aware that Buyers are being more disciplined, homes are taking longer to sell, and pricing strategy matters more than ever.
California’s Proposition 19 now allows homeowners aged 55+ to transfer their existing real estate tax base to a home anywhere in California; this law encourages some older Sellers who wish to sell their current homes and downsize. The imbalance between Santa Barbara’s low housing supply and high demand is more pronounced than in most national cities, so over the years, there has been a surge in local property values. While market corrections may still negatively impact property values on the Santa Barbara South Coast, the impact is expected to be less severe compared to many other areas in the state and country. New 2026 listings may have remained on the market a bit longer than in 2025, but they continue to sell. Home values in the Santa Barbara South Coast Real Estate Market continue to be supported by supply and demand dynamics due to our current market’s persistent low listing inventory. Pre-pandemic House/PUD active listings as of May2019 totaled 378; as of May 1st 2026, there are now 194 active listings, which equates to 49% fewer active listings than in 2019.
Review the attached list of the 134 properties sold on the Santa Barbara South Coast in May 2026, and contact me for information on specific sales in our area.
Stan Tabler, CRS, GRI, ABR, GREEN
Compass
801 Chapala Street
Santa Barbara, CA 93101
805.689.2305
DRE #00774377 since 1980