
The decision to purchase real estate or to place your home for sale in the Santa Barbara real estate market can be one of the biggest you and your family will make at any given time. This decision can be made easier if you are adequately informed about the buying and selling process, the local real estate market and the neighborhoods and communities in which you are interested. As a local real estate professional with more than thirty years of experience helping buyers and sellers just like you, it would be my great pleasure to introduce you to the Santa Barbara Real Estate Services I offer to both buyers and sellers.
For sake of simplicity, buying a home is a three-step process: finding the right community, finding the right home and negotiating the best contract terms. For your convenience, I have compiled a wealth of information on local communities and their real estate trends as well as provided you access to the search the entire Santa Barbara MLS to view available properties. Once we have narrowed down the ideal community and the right home, I will use my many years of experience and expertise and my Santa Barbara Real Estate Services to negotiate the contract terms to suit your needs and to exceed your expectations.
For sellers, I believe you will find my commitment to untiring communication and service, masterful marketing and negotiation skills to be most refreshing. Resulting from years of extensive experience and research, a superior ability to anticipate problems and solve them and unsurpassed ethics and professionalism, you will find these qualities will help your home sell quickly and for its highest dollar.
Whether you are moving across town or across the country, it would be my great pleasure to assist you with all your housing needs and to share my Santa Barbara Real Estate Services with you and your family. Please feel free to browse my Santa Barbara Home Buying and Selling Tips at your leisure and do not hesitate to contact me, Stan Tabler at your convenience. I look forward to hearing from you soon and assisting you with all your real estate goals, big and small.
Santa Barbara South Coast Real Estate Update
April 17, 2024
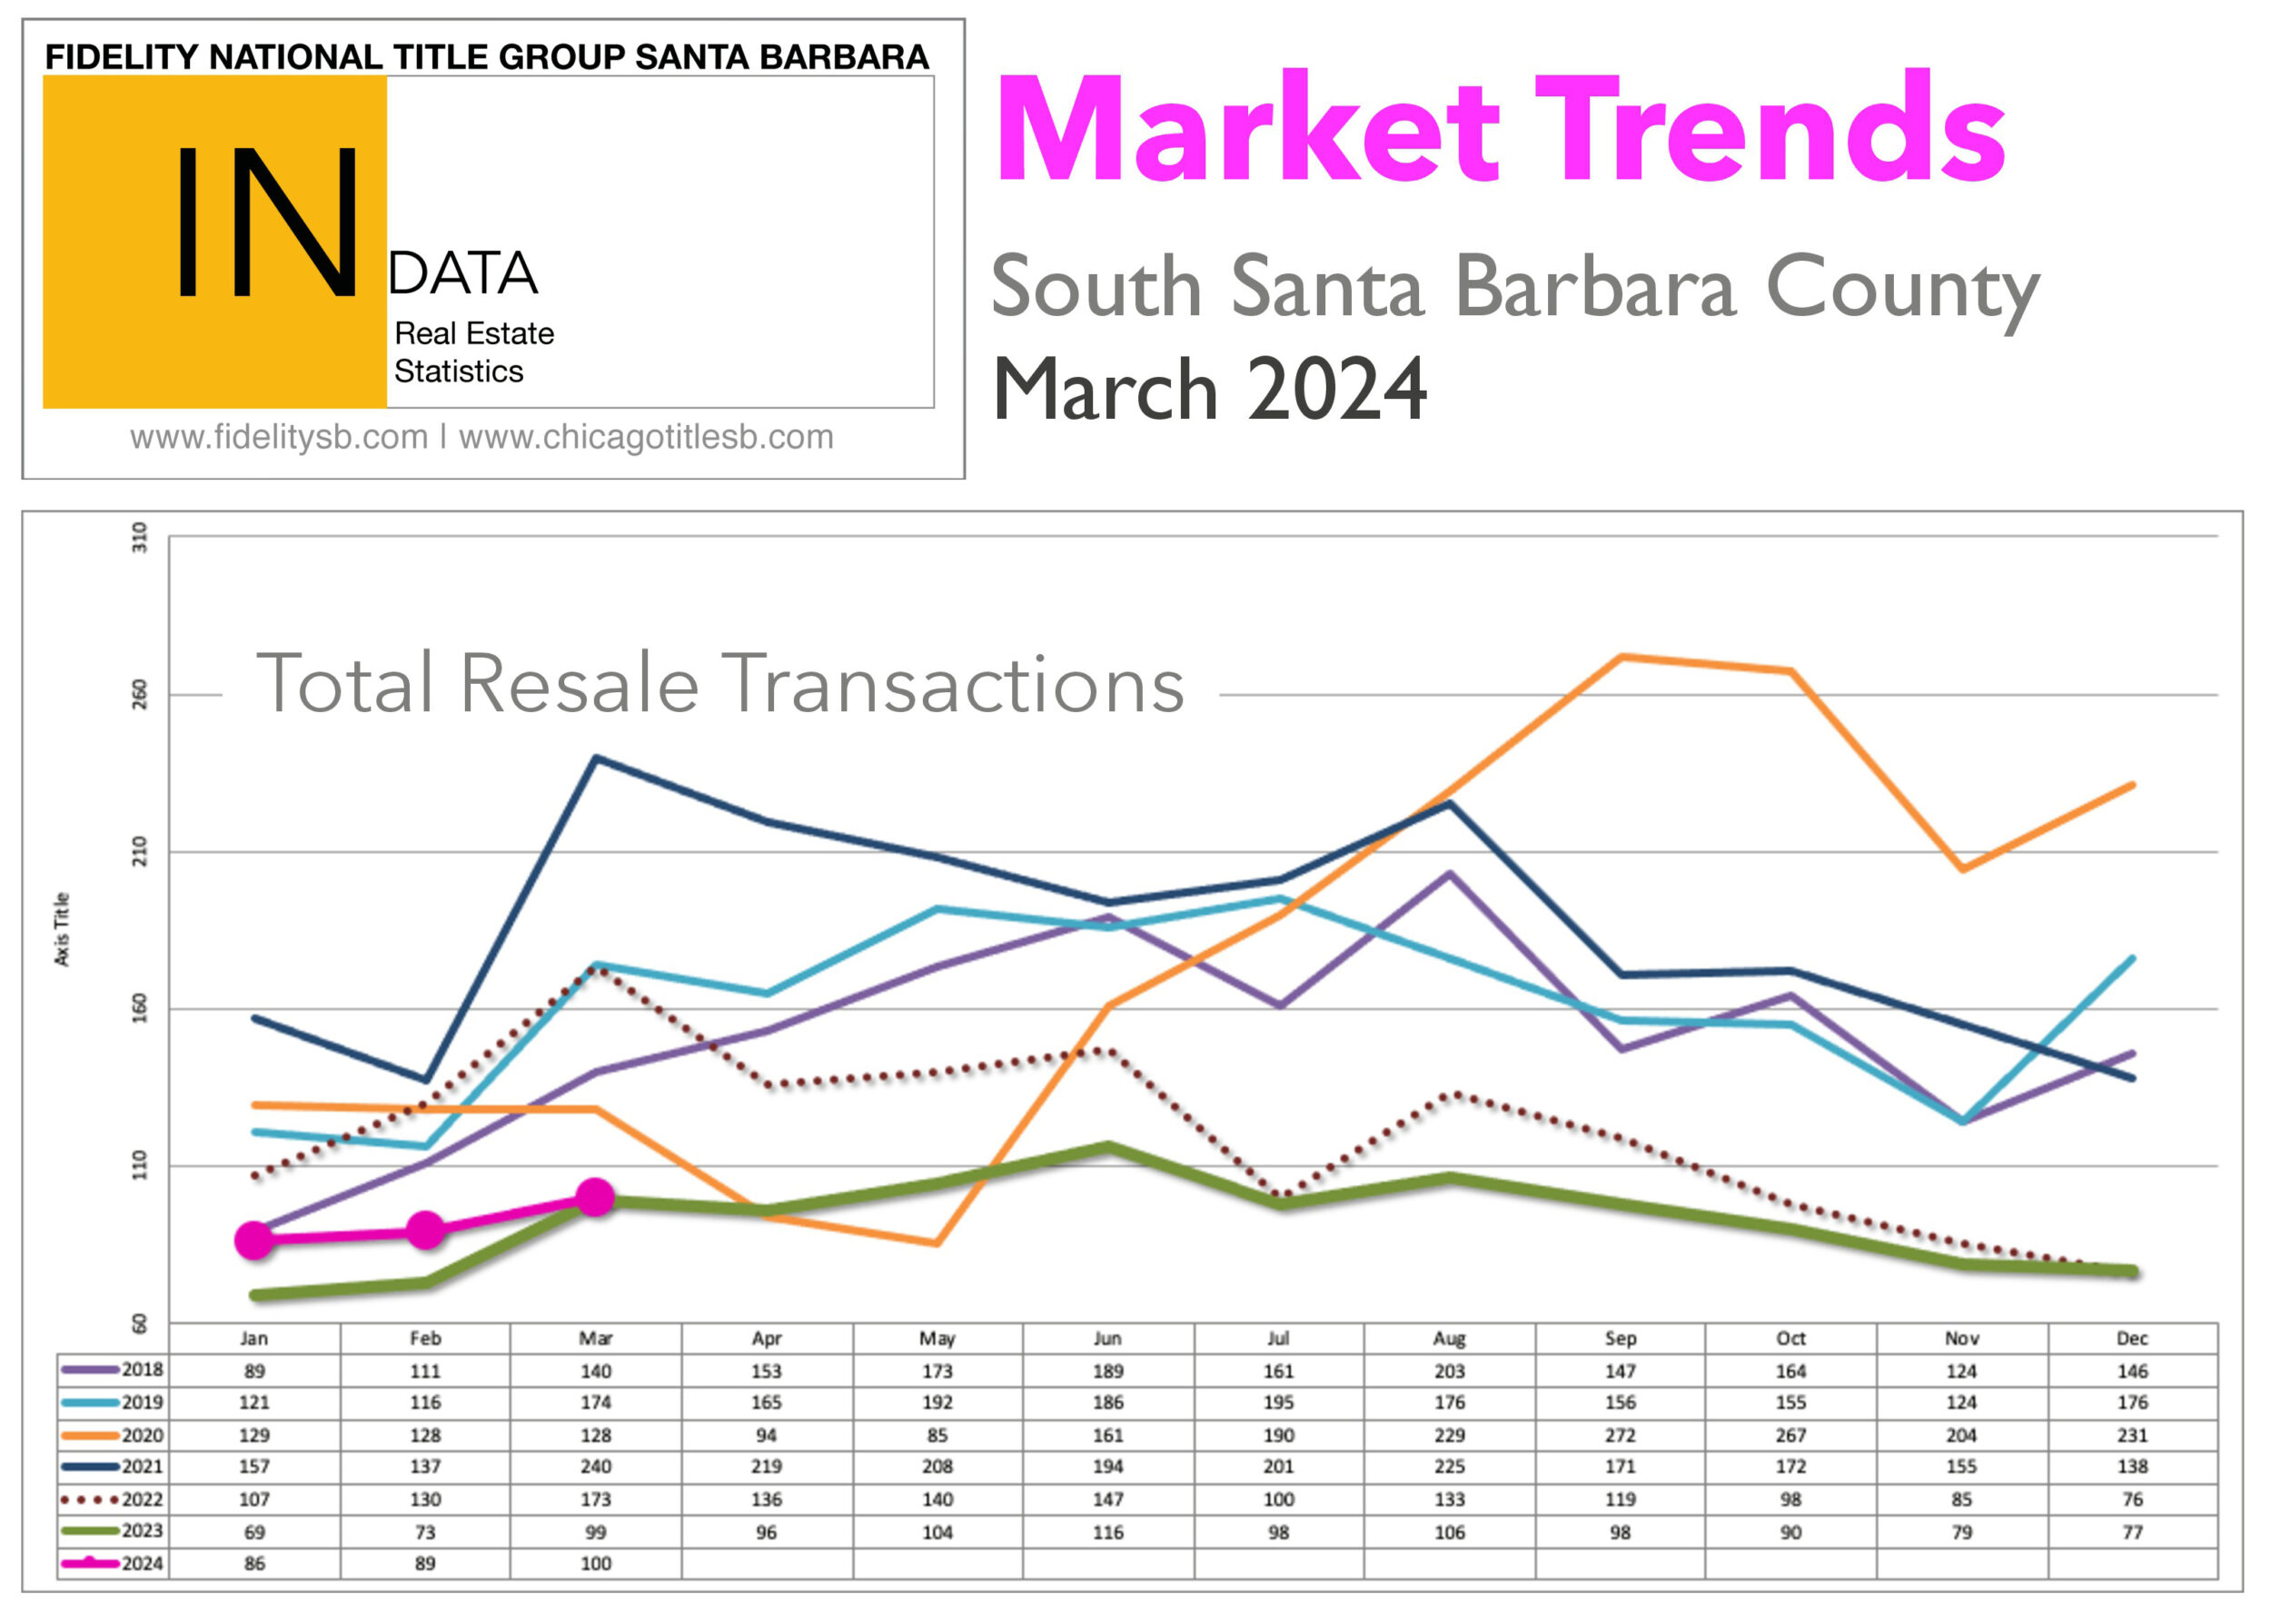
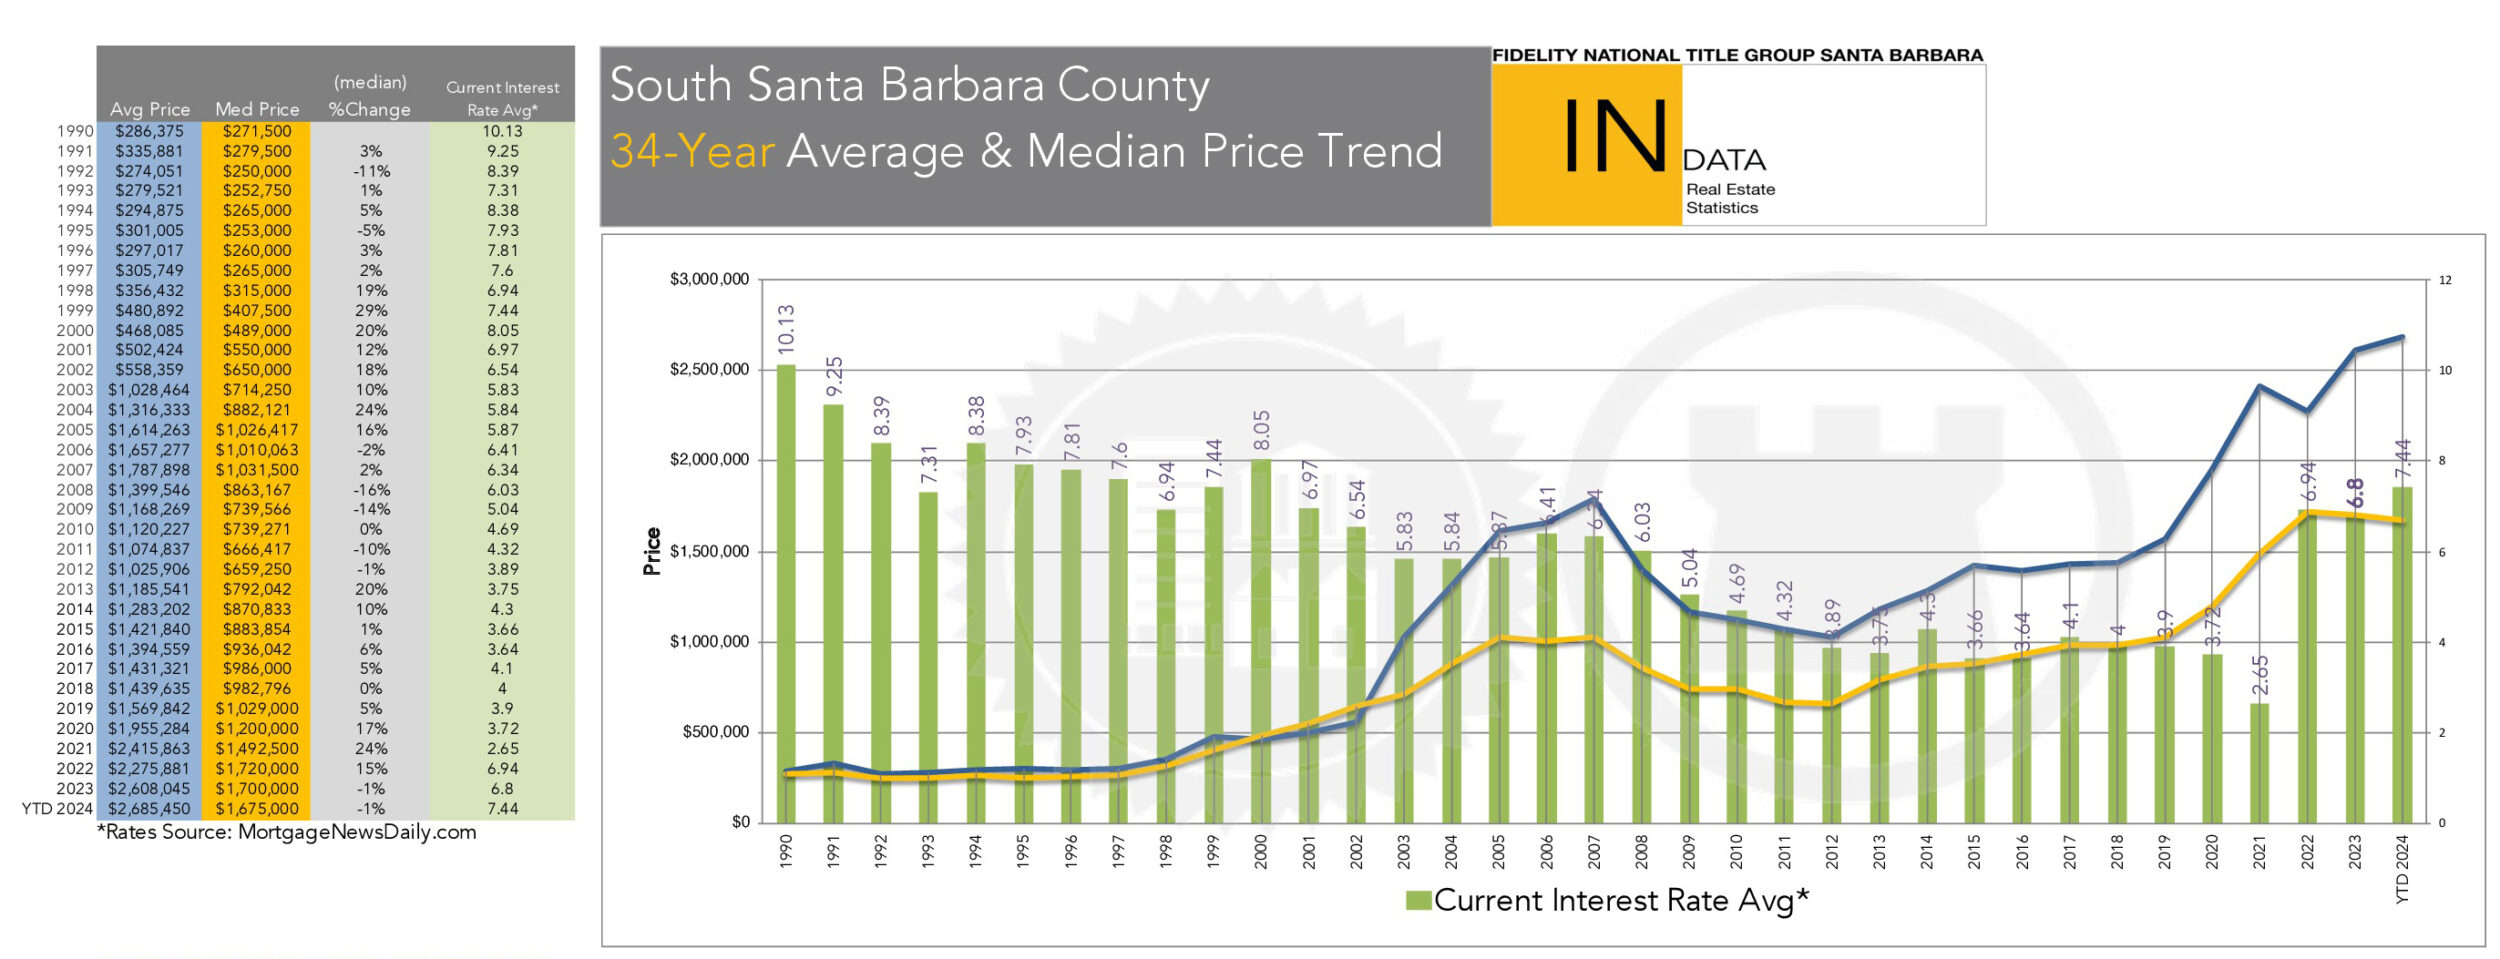
According to data obtained from the County Recorder’s Office by Fidelity National Title, residential property sales on the Santa Barbara South Coast decreased by 1% in March 2024 with 100 sales recorded as compared to 101 in 2023. Out of the 100 sales in March 2024, 77 were houses or in planned unit developments (PUDs), up 15% from 2023. The median sale price of these House/PUD sales was $2,100,000, down 7% from 2023 and the average sale price was $2,864,342, down 12% from 2023. There were 32 Condominium sales in March 2024, down 28% from 2023. The median sale price of these Condominium sales was $1,039,000, down 15% from 2023, and the average sale price was $1,220,491, down 9% from 2023. Year-to-date in 2024, there has been a total of 274 residential sales on the Santa Barbara South Coast, up 14% from 2023. The Year-to-Date median sale price for all residential sales as of March 2024 was $1,675,000, and the average sale price was $2,685,450.
In Carpinteria, there were a total of 6 residential sales in March 2024, down from 11 in February. In March 2024 there were 4 House/PUD sales, up from no sales in February. In March 2024 the median price of the 4 House/PUD sales was $1,289,588 and the average price was $1,306,794. In March the median and the average price of the 2 Condominium sales was $699,250. The lowest-priced Carpinteria sale in March 2024 was a Condominium on Hickory Street @ $587,000 and the highest was a PUD on Lagunitas Court @ $1,675,000.
There were no sales in Summerland in February or March 2024.
In Montecito, there were a total of 12 residential sales in March 2024, down from 13 in February. In March 2024 the median price of the 10 House/PUD sales was $6,170,000 and the average price was $7,248,500. In March the median and average price of the 2 Condominium sales was $3,100,000. The lowest-priced Montecito sale in March 2024 was a Condominium on Fairway Road @ $1,700,000 and the highest was an Estate on Mimosa Lane @ $16,500,000.
In Santa Barbara, there were a total of 48 residential sales in March 2024, up from 41 in February. In March 2024 the median price of the 41 House/PUD sales was $2,093,750 and the average price was $2,393,044. In March 2024 the median price of the 7 Condominium sales was $900,000 and the average price was $981,571. The lowest-priced Santa Barbara sale in March 2024 was a Condominium on Gutierrez Street @ $417,000 and the highest was a House on Largura Place @ $4,950,000.
There was 1 sale in Hope Ranch in March 2024, up from 0 in February and down from 2 in January. The single sale was a House on Monte Drive @ $6,618,000.
In Goleta, there were a total of 33 residential sales in March 2024, up from 24 in February. In March 2024 the median price of the 21 House/PUD sales was $1,595,000 and the average price was $1,814,733. In March 2024 the median price of the 12 Condominium sales was $1,195,000 and the average price was $1,133,483. The lowest-priced Goleta sale in March 2024 was a Condominium on Armitos Avenue @ $525,000 and the highest was a House on Franklin Ranch Road @ $2,695,000.
Analysis
The real estate market on the Santa Barbara South Coast has been affected by various factors. As of April 1st, there were 122 active House/PUD listings, up from 119 in March, and 33 active Condominium listings, down from 34 in March, available along the Santa Barbara South Coast. The current housing supply shortage will continue to put pressure on housing values as the reduction in supply has now continued into 2024. Compare our current supply levels to 2007 to 2011 when the total number of active listings for Buyers to choose from fluctuated between 734 and 1,026. Historically the highest number of active listings along the Santa Barbara South Coast was recorded in June of 1992 when there were an astonishing 1,297 active listings available for Buyers to choose from.
Bank-owned sales on Santa Barbara’s South Coast have been very rare; in all of 2021 and 2022, there were only 4 bank-owned sales. In 2023 there were no bank-owned sales and only 1 short sale on W. Figueroa Street. Currently, the one bank-owned listing that was available expired after 436 days on the market (but may be still privately available): an oceanfront estate on Marina Drive in Hope Ranch last listed for $21,500,000 which may rate as the highest-value bank-owned residential property in California. According to the latest MBA National Delinquency Survey (NDS) as of February 2024, the overall delinquency rate for mortgage loans on one‐to‐four‐unit residential properties increased to a seasonally adjusted rate of 3.88% of all loans outstanding at the end of the fourth quarter of 2023. The delinquency rate was up 26 basis points from the third quarter of 2023 but down 8 basis points from one year ago. The historical average for the seasonally adjusted mortgage delinquency rate from 1979 through 2023 is 5.25%. To review the entire Mortgage Bankers Survey, check out this link: https://newslink.mba.org/mba-tag/mba-national-delinquency-survey/ .
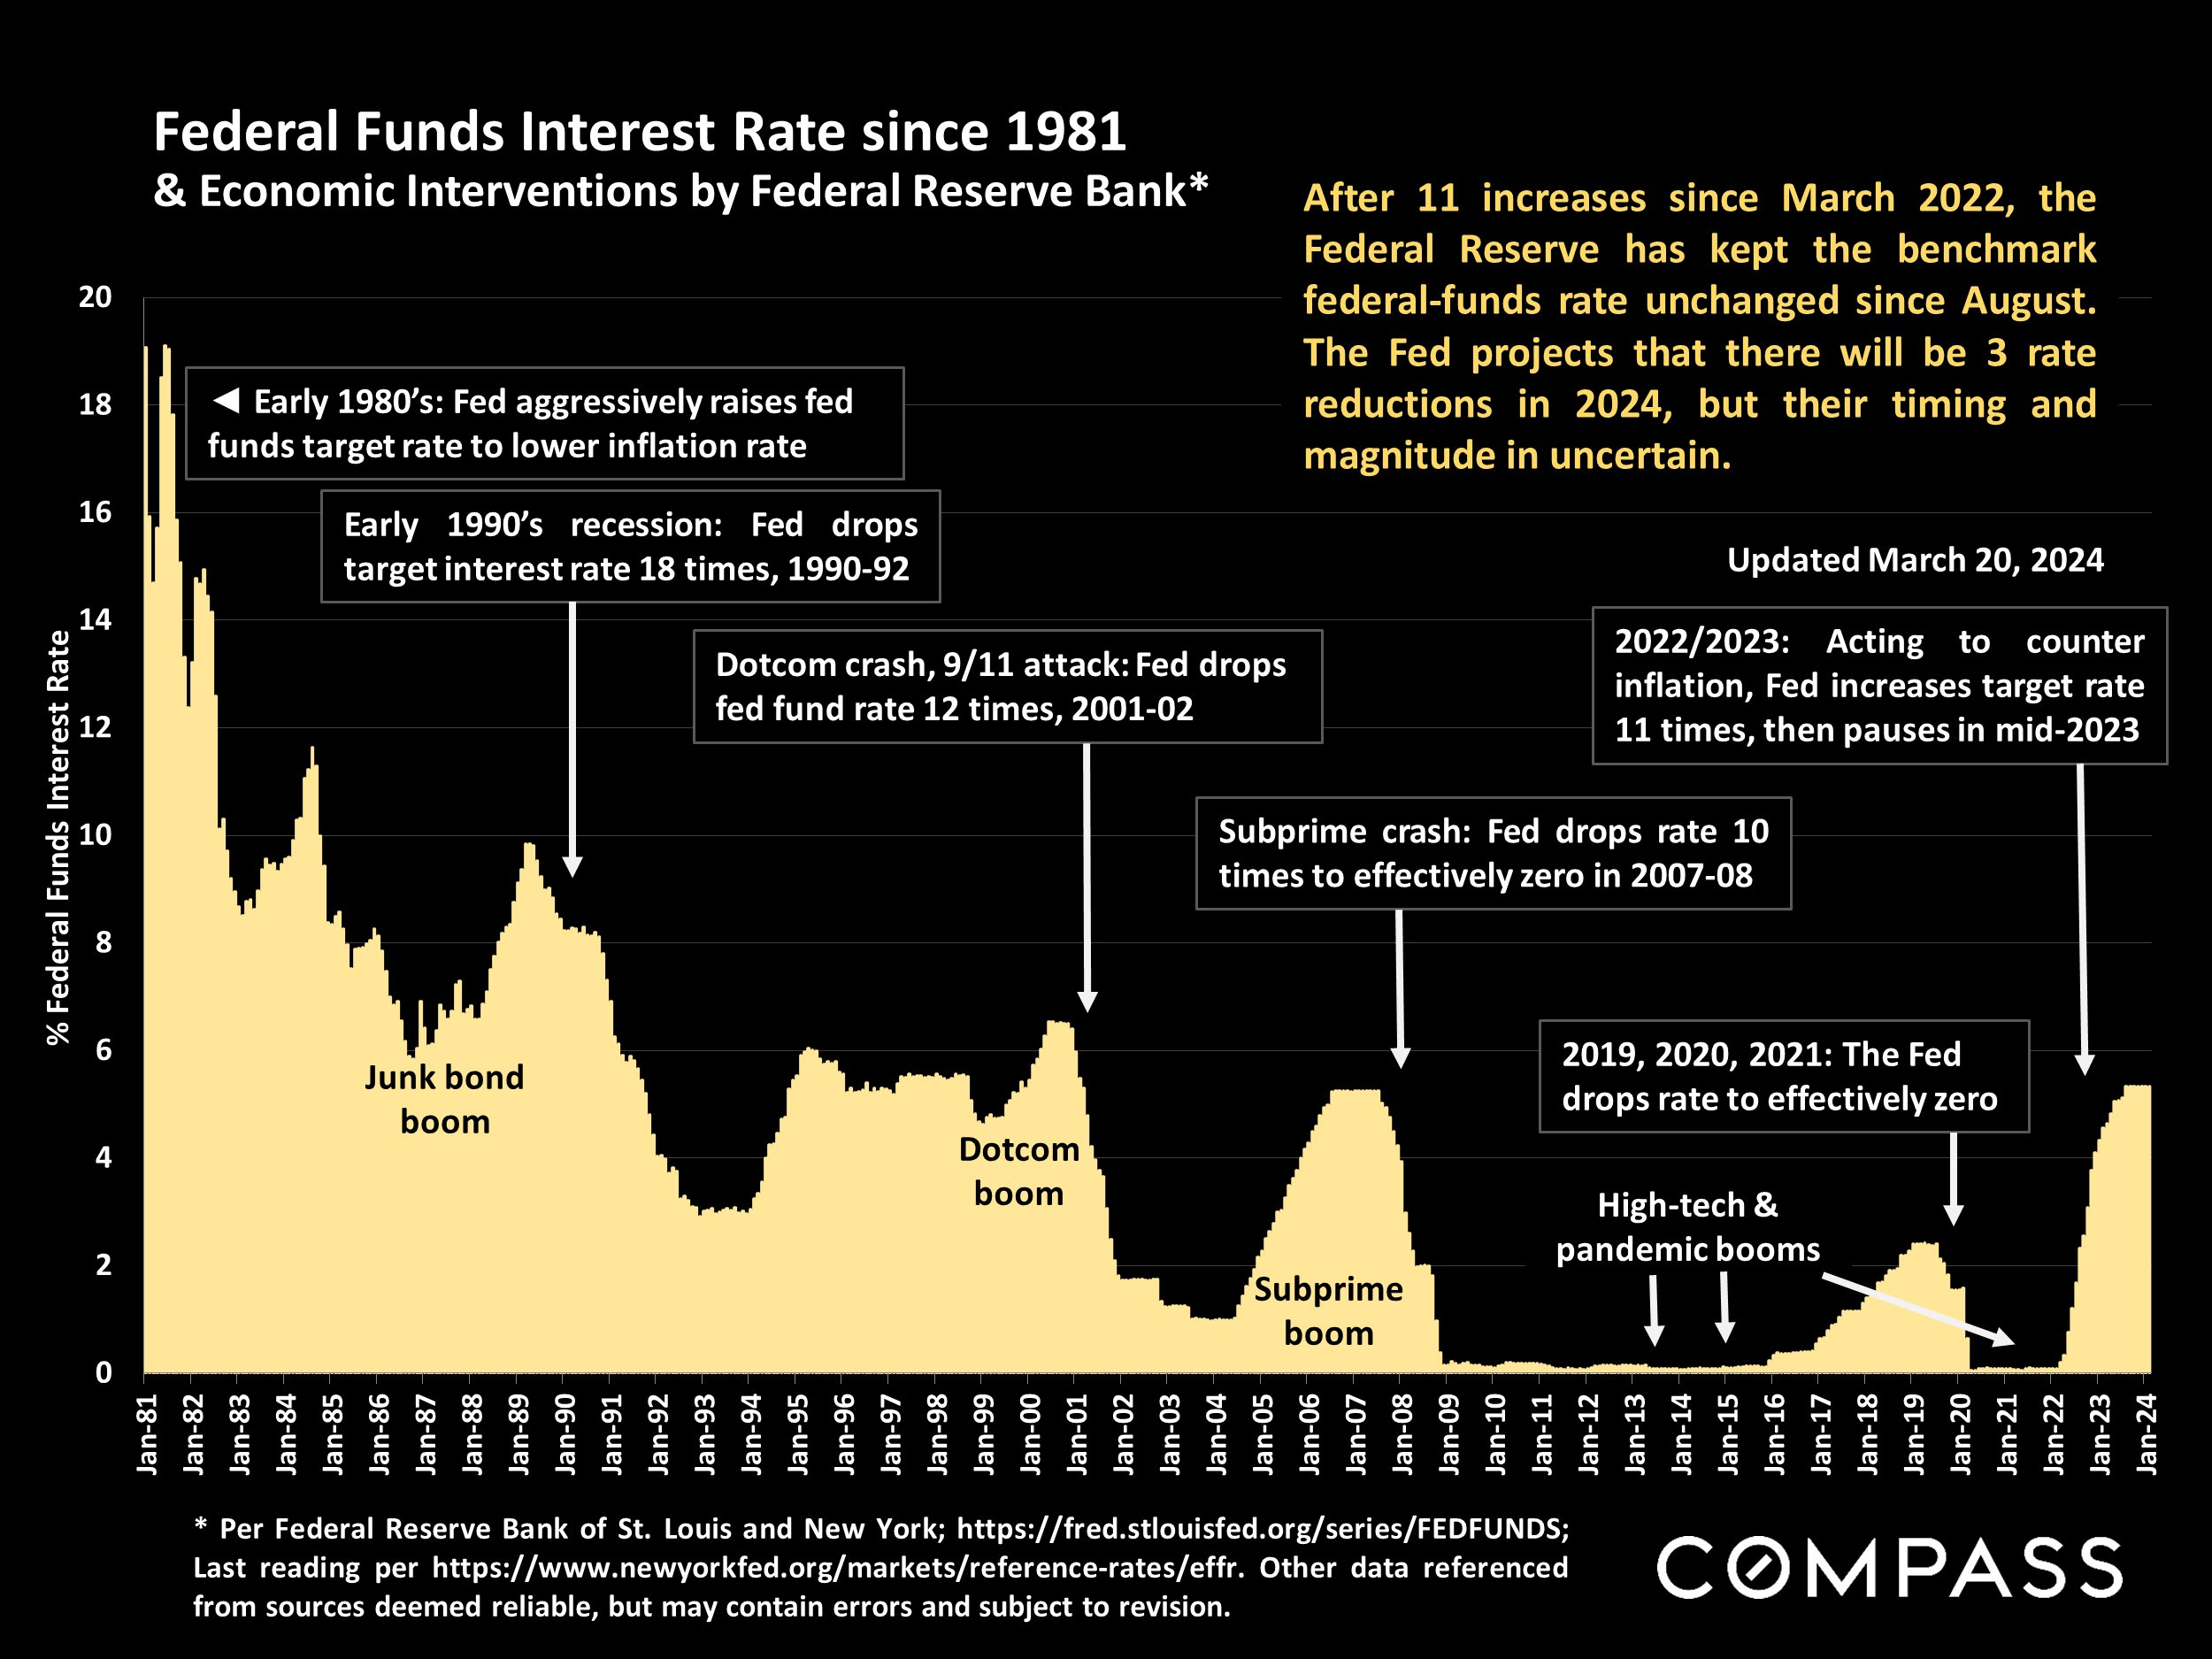
Federal Reserve officials signaled on March 20th that they expect to cut the Federal Funds rate three times in 2024, down from the four times they projected in December, and did not change the current Federal Funds rate. January’s and February’s slight increase in the inflation rate, Chairman Jerome Powell said, “haven’t really changed the overall story, which is that of inflation moving down gradually on a sometimes bumpy road towards 2%. Inflation has come way down, and that gives us the ability to approach this question carefully and feel more confident that inflation is moving down sustainably. It is still likely … that we will see that confidence and that there will be rate cuts.” To see the whole article, check out https://apnews.com/article/federal-reserve-inflation-prices-interest-rates-cuts-502ced8f228ee469f84fc6f2eeea6e3e
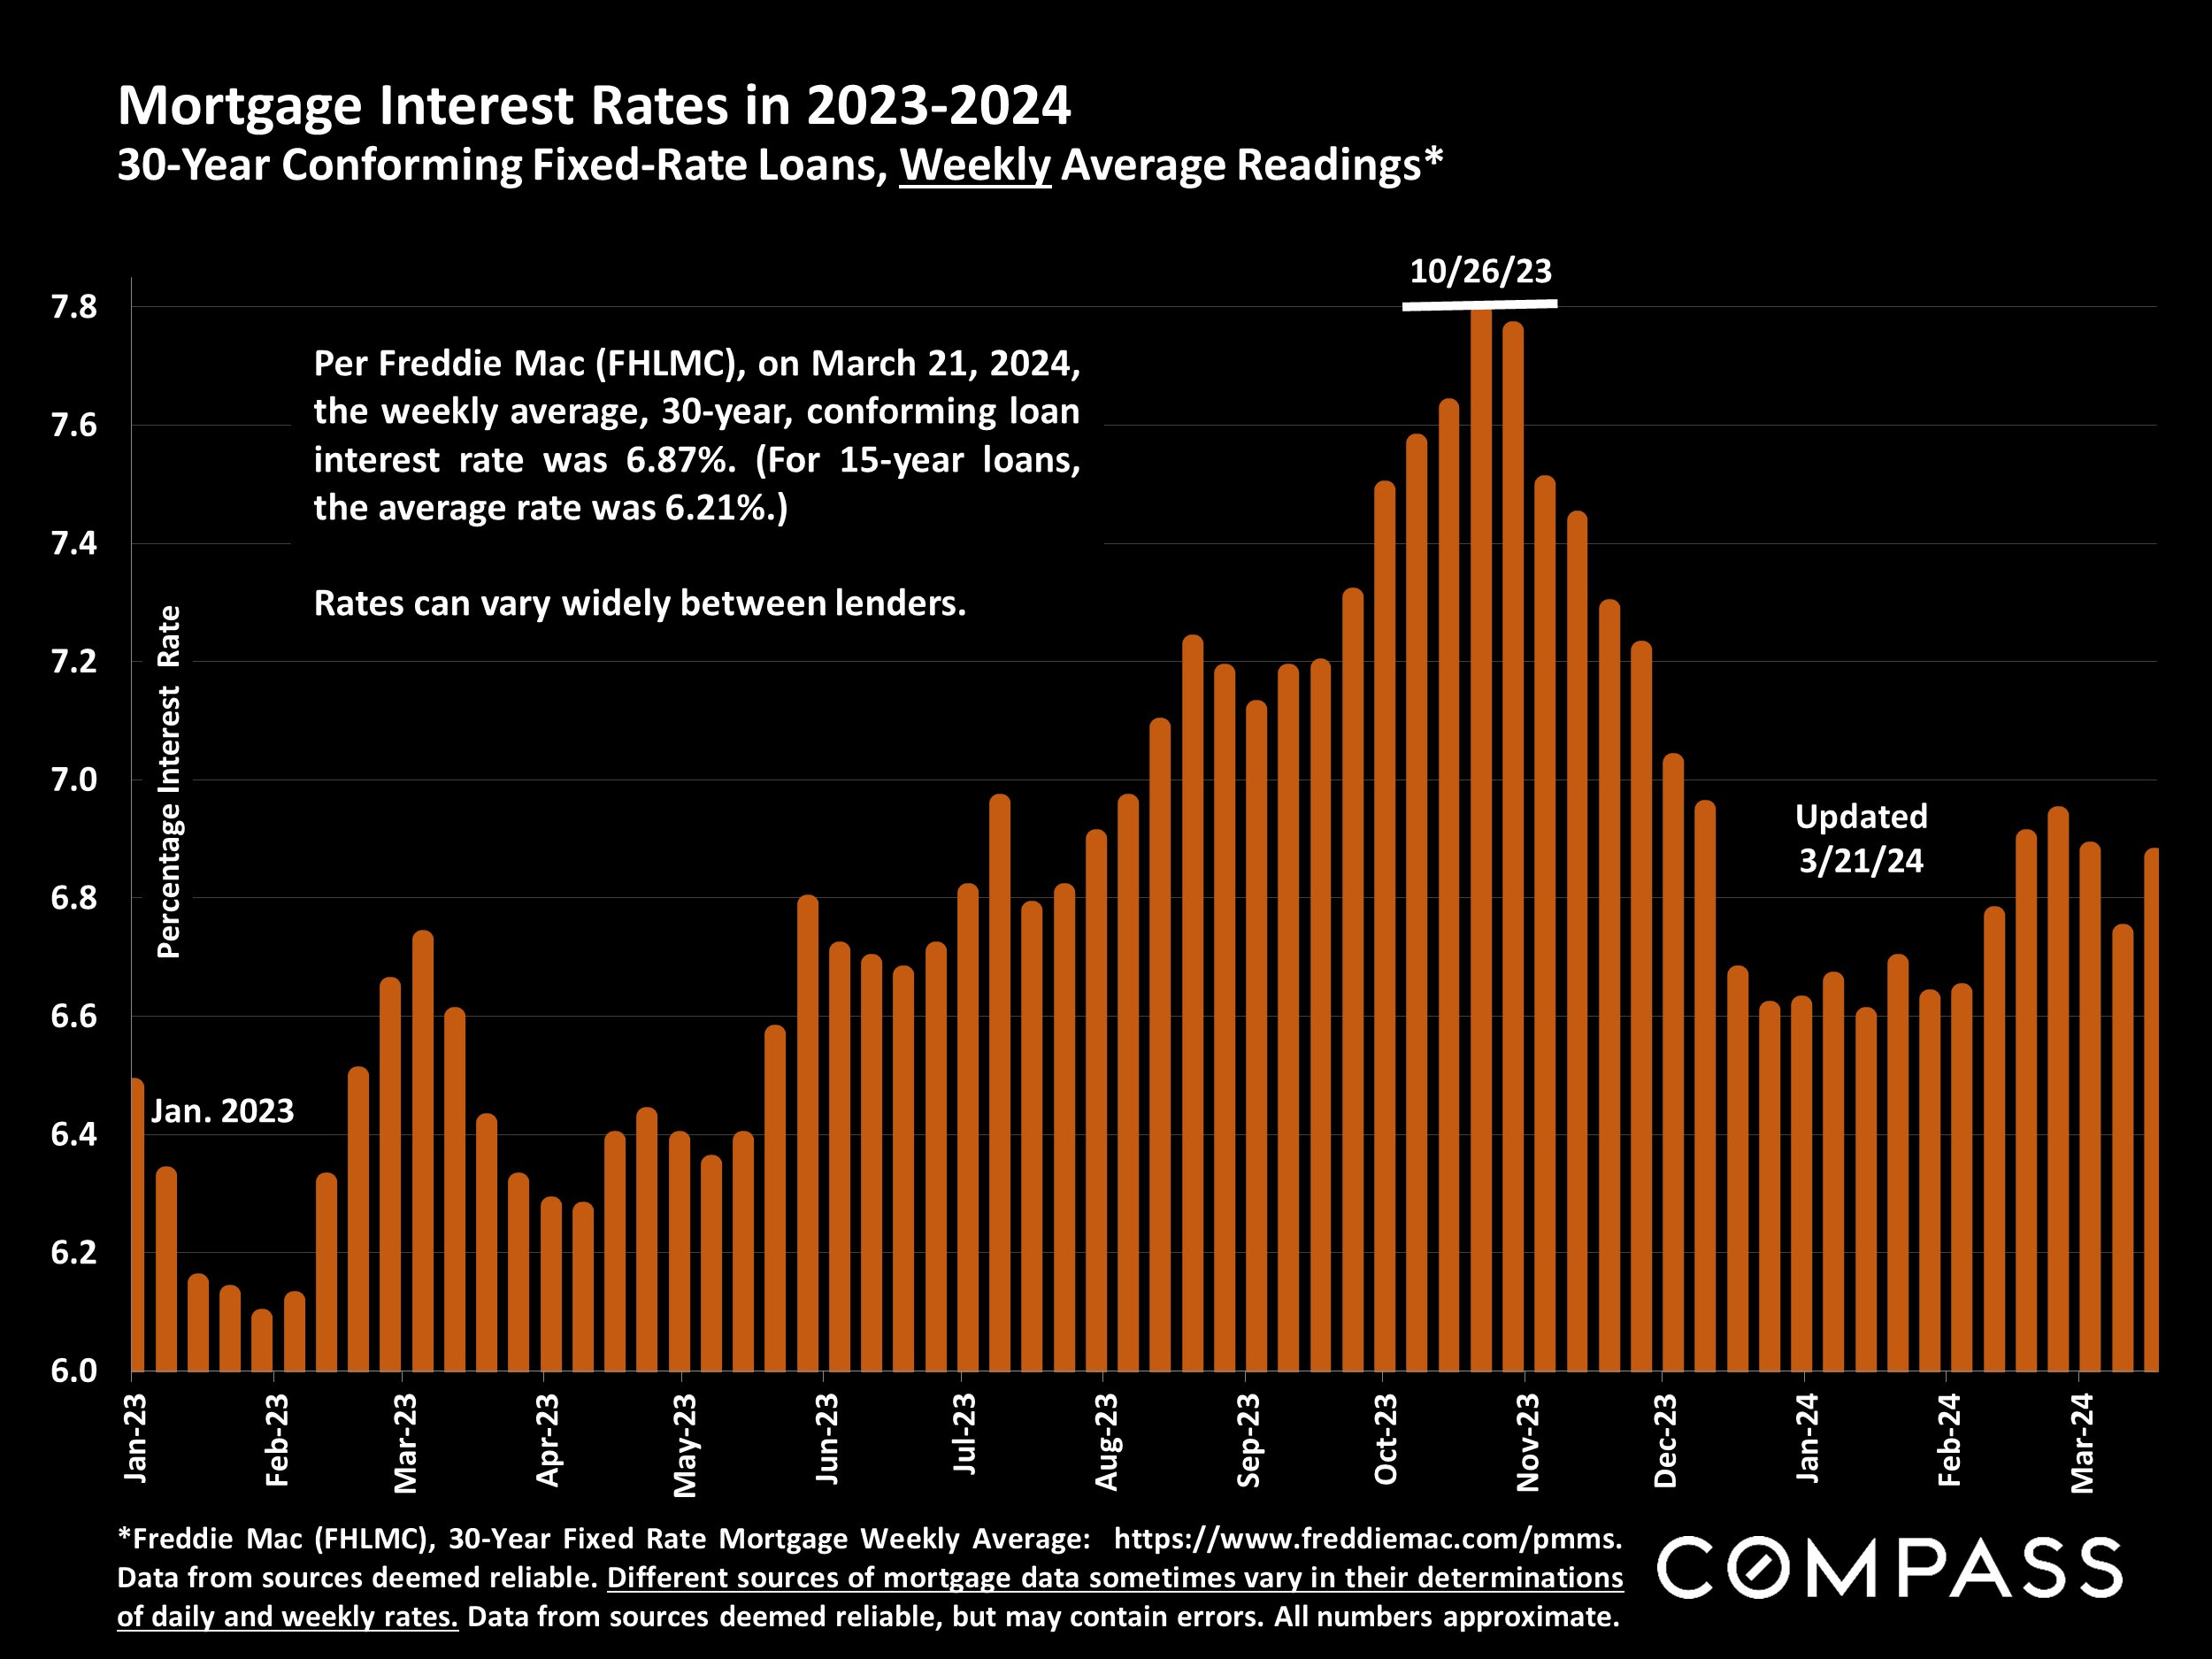
Mortgage interest rates have doubled since the beginning of 2022. As of April 1st, if you shopped around you could lock in a $838,350 30-year fixed-rate conforming mortgage at 6.79% (up from 6.65% in March). Historically the lowest 30-year mortgage interest rate since 1970 was recorded in February 2021 at 2.65% and that rate was matched yet again in July 2021 during the pandemic. The highest historical 30-year fixed-rate interest rate was recorded in 1981 @ 18.63%. The average 30-year fixed-rate mortgage interest rate over the last 50 years has been 7.74%, so now rates are still lower than that average. Mortgage rates of 7.79% in October 2023 were at a 23-year high following all-time lows reached just three years ago highlighting the effect that financing costs have on the housing market, a particularly rate-sensitive sector of the economy. As a comparison, a mortgage payment for a $838,350 mortgage in 1981 would have been $13,066/month, the payment in July 2021 would have been $3,378/month, and as of April 1st, that payment would be $5,460/month. Many potential buyers are now back on the hunt for homes in anticipation of fixed-rate mortgages moving even lower later in 2024. Another reason for low inventory levels is that many would-be Sellers are still hesitant to sell their homes as roughly 59% currently have mortgage interest rates below 4%, and close to 23% of homeowners have rates below 3%.
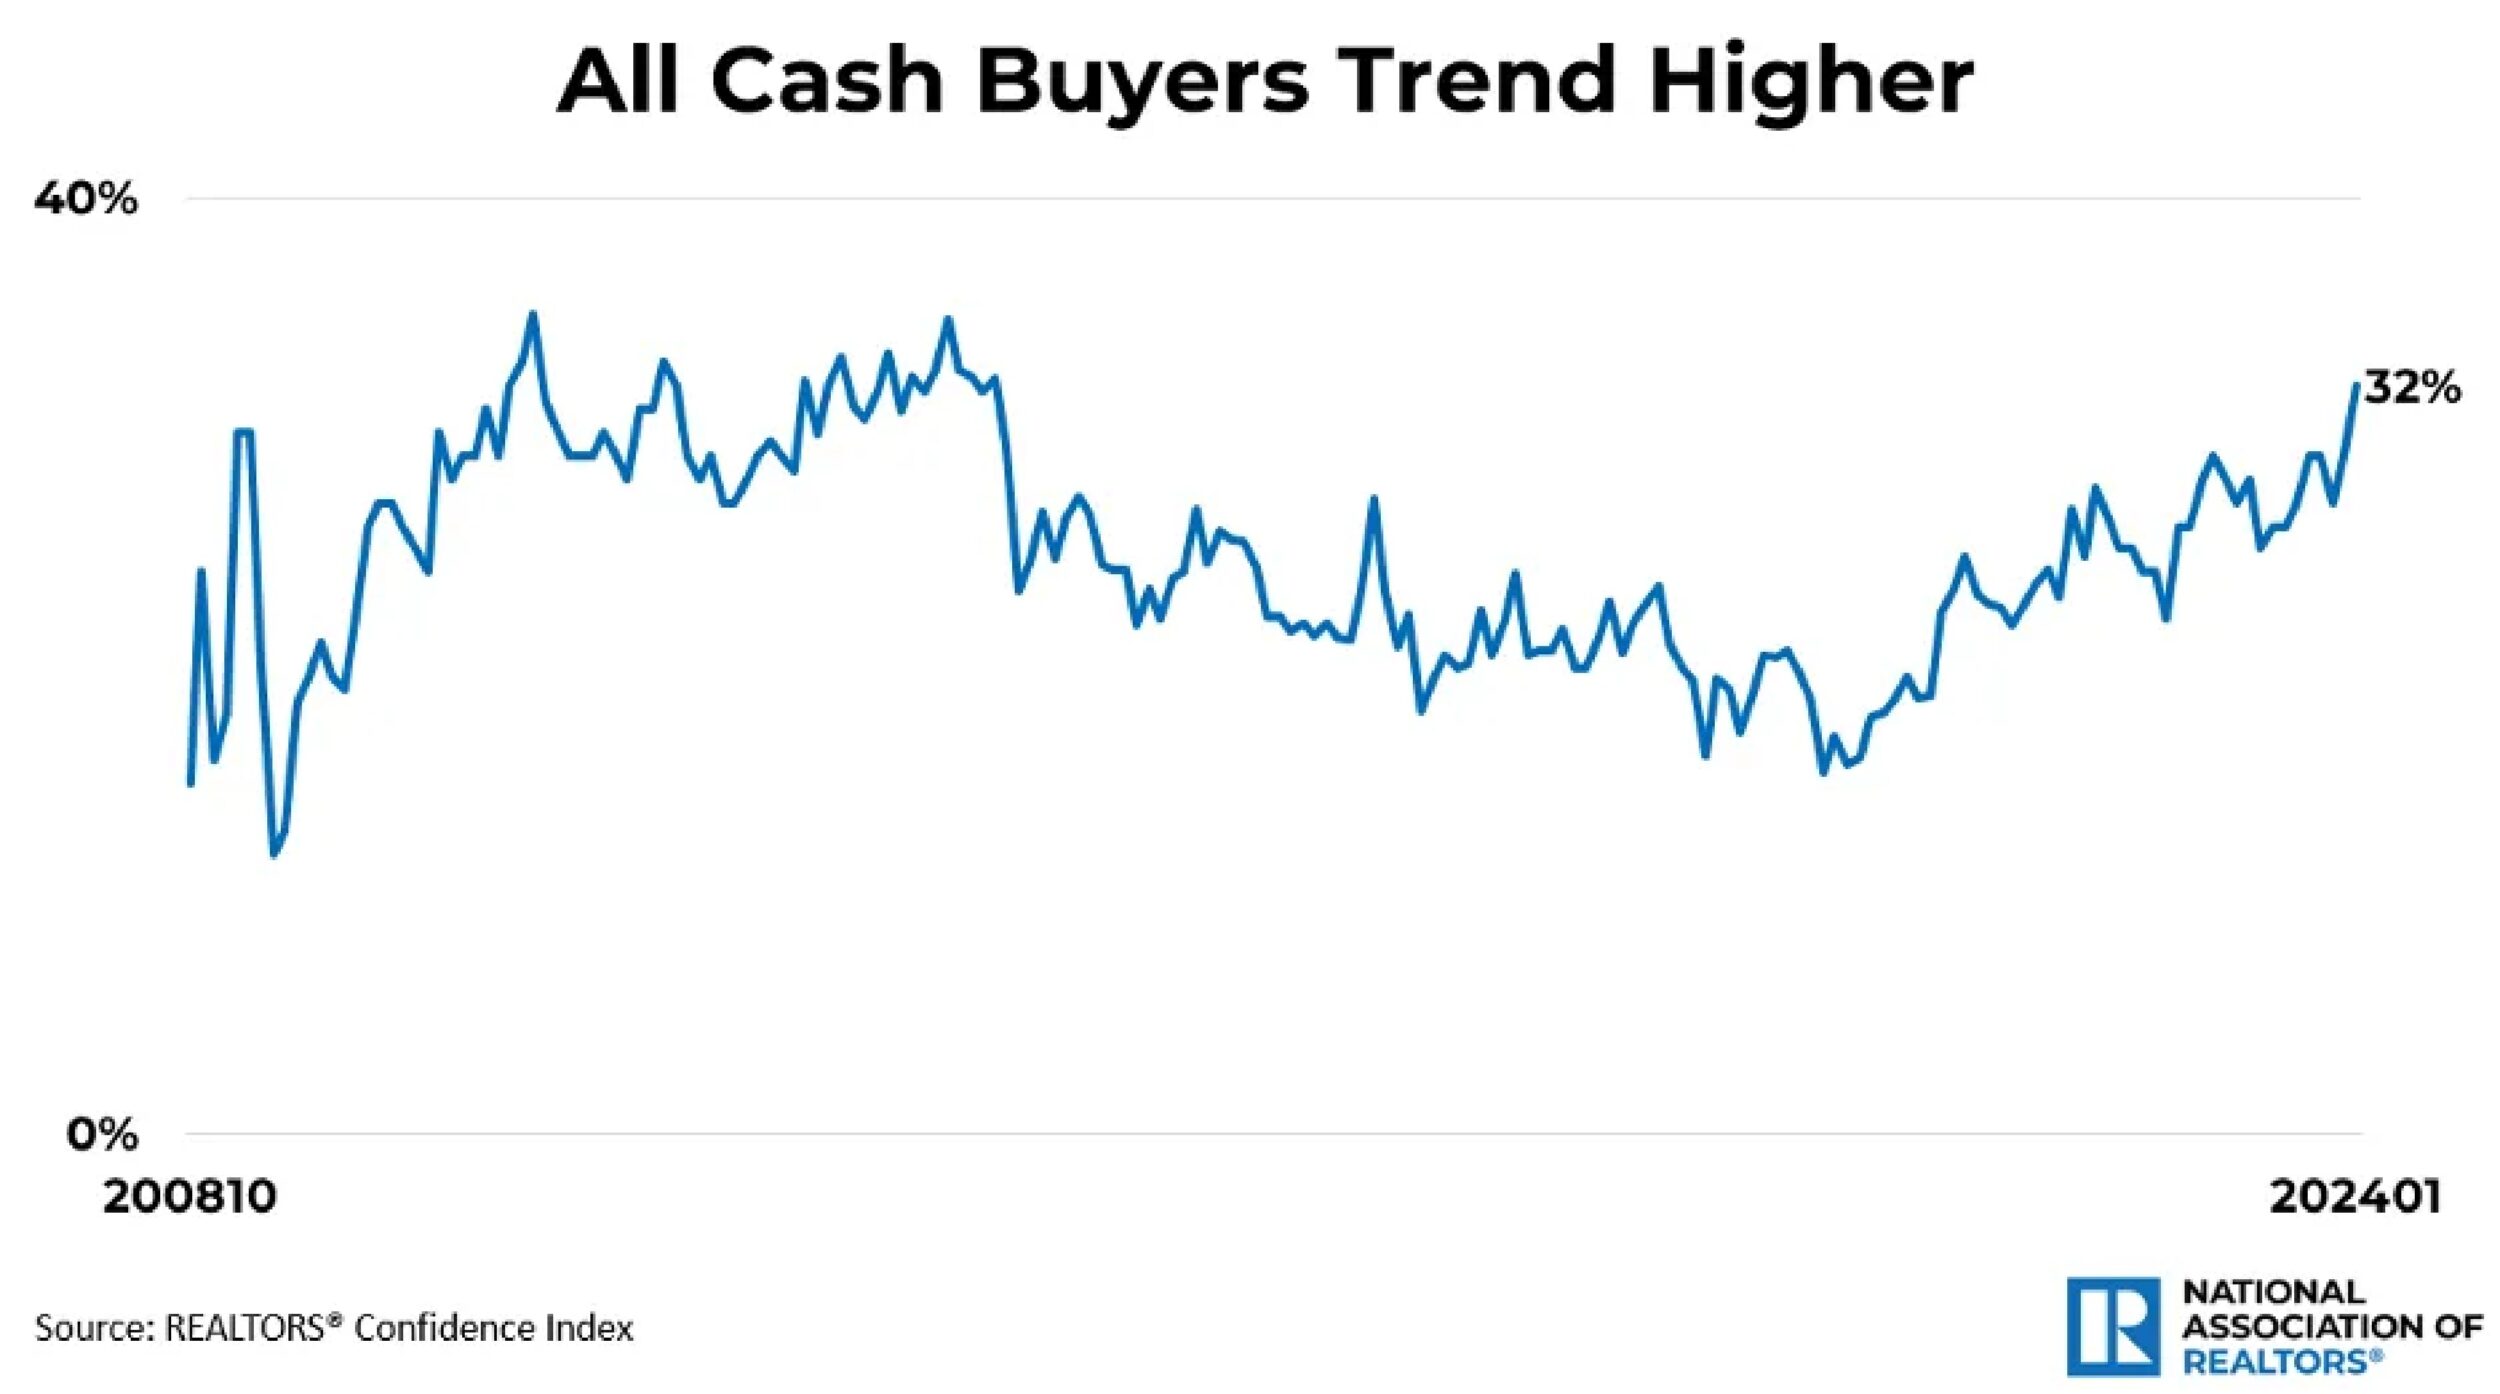
According to NAR Economists’ Outlook, all cash home buyers have trended up significantly in recent months. Since October 2022, all-cash home buyers who did not finance their recent home purchase have been more than 25% of the sales. In March 2024, all-cash buyers now stand at 32% of home sales. The last time the share of all cash buyers was this high was back in June 2014. In highly sought out areas, including Santa Barbara, cash Buyers represent a much higher percentage of sales: 69% in the City of Carmel, 65% in Manhattan (New York), 57% in Pebble Beach, and 54% in Pacific Grove. On the Santa Barbara South Coast in March 2024, the percentage of cash sales was 43%, down from 47% in February and up from 41% in January.
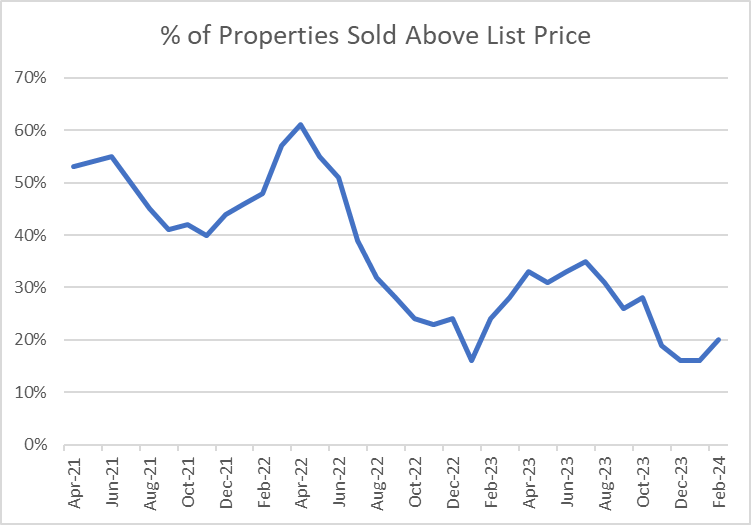
Inventory of available properties remains low and that is creating tough competition among Buyers creating bidding wars and pushing up prices. According to Zillow, “Home values climbed month-over-month in each of the 50 largest metro areas in March. Gains were strongest in San Jose (3.3%), San Francisco (2.7%), Seattle (2.4%), San Diego (2.1%), and Los Angeles (2%).” During the month of March, many Santa Barbara properties sold over their list (asking) price. Notable overbids were; Largura Place which sold $1,055,000 over the list price after 11 days on the market, La Jolla Drive which sold $706,000 over the list price after 6 days on the market, Canon Drive which sold $550,034 over the list price after 10 days on the market, Loma Street which sold $300,000 over the list price after 7 days on the market, Murrell Road which sold $141,000 over the list price after 3 days on the market, Mariana Way which sold $140,000 over the list price after 2 days on the market, and Alameda Padre Serra which sold for $75,000 over the list price after 9 days on the market. All but one of these were cash sales! Sales like these are indicative of how Buyers will pay a premium price to live in Santa Barbara.
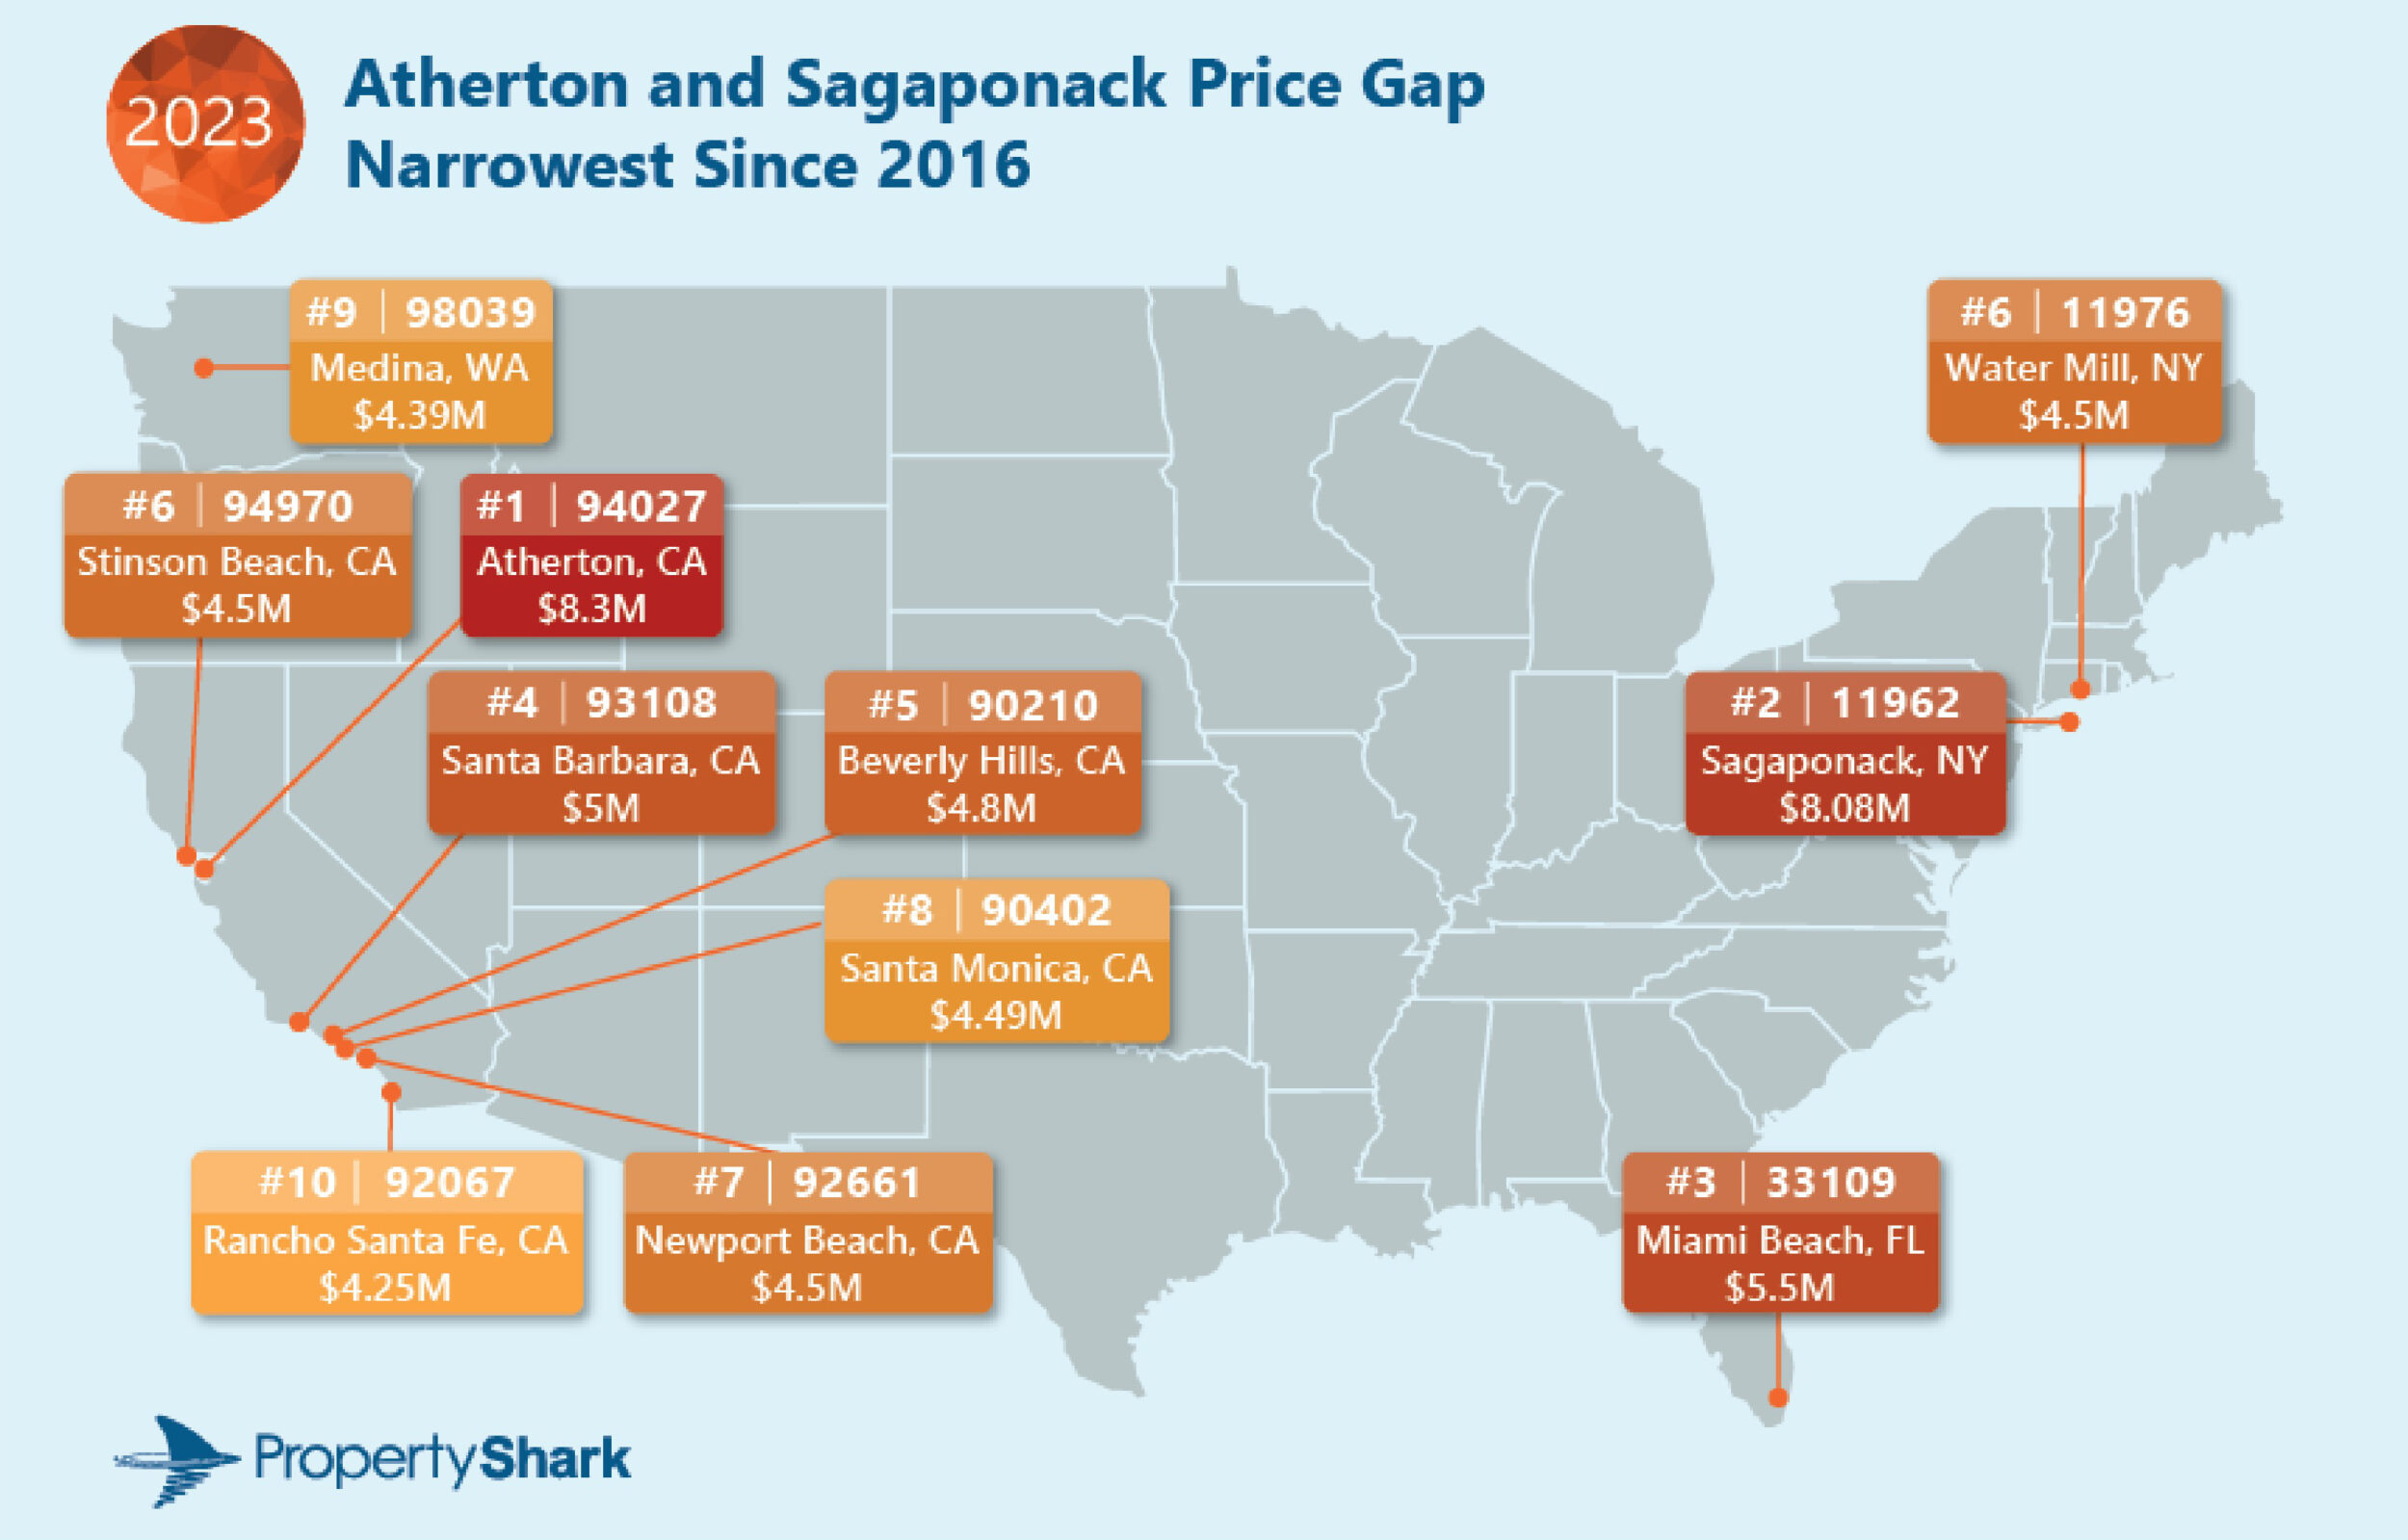
Of the 100 residential sales in March 2024, 87 were over $1,000,000 which equates to 87% of the total sales, up from 77.1% in February and 77.6% in January. The South Coast of Santa Barbara is not an inexpensive place to purchase real estate compared to most areas of the United States, but again many people will pay more to live and invest in Santa Barbara. According to PropertyShark’s once-a-year report (November 2023), California had 6 (down from 7 in 2022) of the 10 most expensive median-priced ZIP codes in the country. Montecito’s 93108 ZIP code came in at #4 (up from #8 in 2022) of the most expensive ZIP codes in the USA, even beating out Beverly Hills. Check out the full report: https://www.propertyshark.com/Real-Estate-Reports/most-expensive-zip-codes-in-the-us
U.S. News compiled surveys on the 24 most expensive places to live in the United States during the last year. Their surveys were based on the median gross rent and annual housing costs for mortgage-paying homeowners of each city. California had 12 of the 24 (50%!) cities that require the most wealth to live comfortably: Santa Barbara came in at #5. To see the entire article, check out https://realestate.usnews.com/places/rankings/most-expensive-places-to-live
WalletHub assessed the states where people experience the most stress based on Work-related, Money-related, Family, Health, and Safety-related stress……the top 7 most stressful states are West Virginia, Louisiana, Tennessee, Arkansas, Kentucky, Alabama, and Mississippi. The least stressful states are Utah, Hawaii, Maryland, Minnesota, New Jersey, Connecticut, and California! To review this article, check out https://wallethub.com/edu/happiest-states/6959
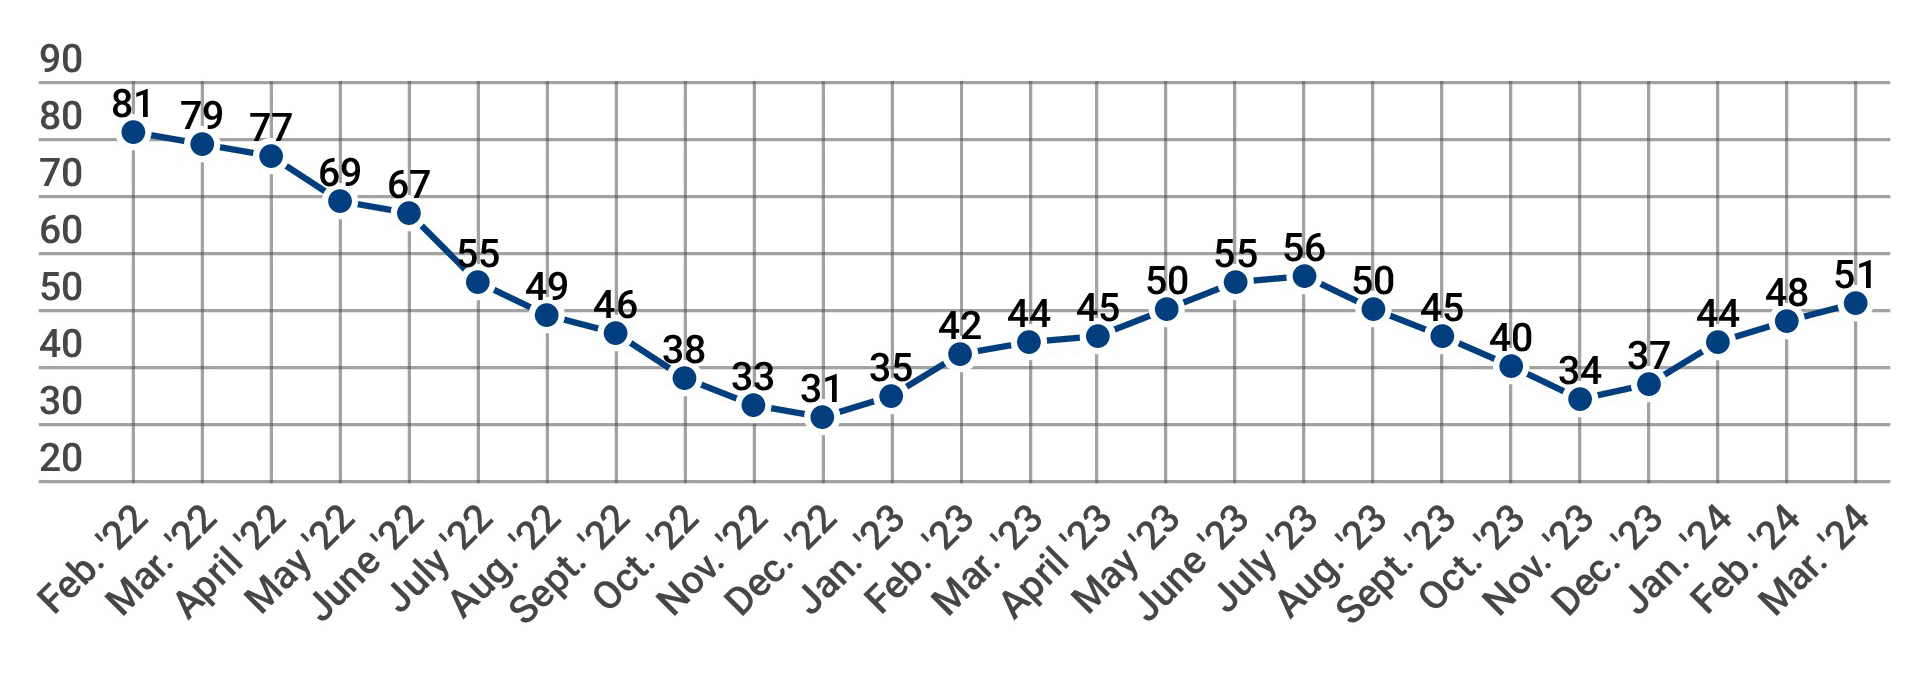
Builder confidence in the market for newly-built single-family homes climbed three points to 51 in March, according to the National Association of Home Builders (NAHB)/Wells Fargo Housing Market Index (HMI) released today. This is the highest level since July 2023 and marks the fourth consecutive monthly gain for the index. It is also the first time that the sentiment level has surpassed the breakeven point of 50 since last July. To review the entire article, check out https://www.nahb.org/news-and-economics/press-releases/2024/03/builder-sentiment-rises-above-breakeven-point
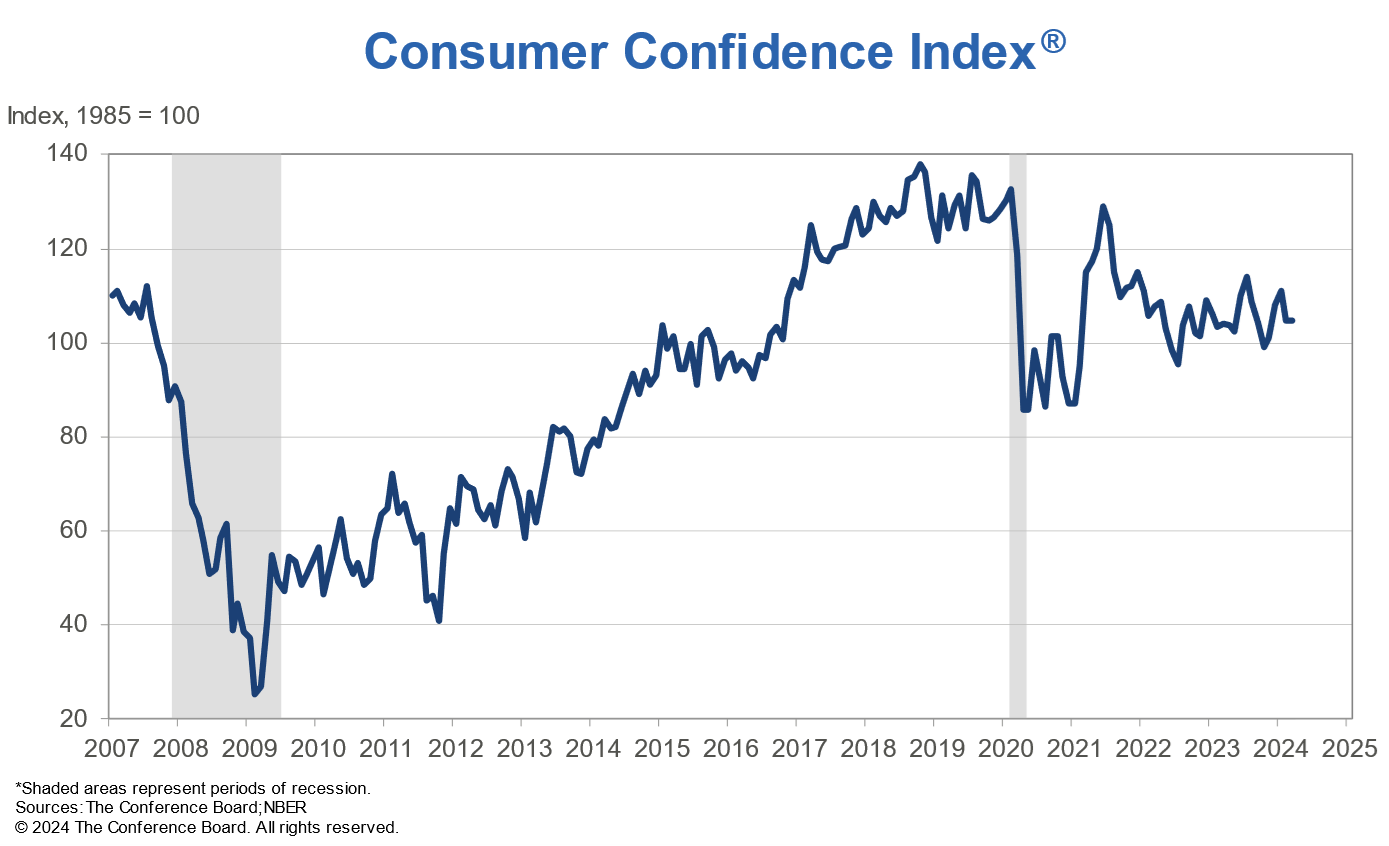
The Conference Board Consumer Confidence Index® was 104.7 (1985=100) in March, essentially unchanged from a downwardly revised 104.8 in February. “Consumers’ assessment of the present situation improved in March, but they also became more pessimistic about the future,” said Dana M. Peterson, Chief Economist at The Conference Board. “Confidence rose among consumers aged 55 and over but deteriorated for those under 55. Separately, consumers in the $50,000-$99,999 income group reported lower confidence in March, while confidence improved slightly in all other income groups. However, over the last six months, confidence has been moving sideways with no real trend to the upside or downside either by income or age group.” To review the entire article check out https://www.conference-board.org/topics/consumer-confidence
As for the worldwide cost of living as of April 1, 2024, Expatistan compiled an index of 182 major worldwide metropolitan areas. In the United States, the most expensive area to live in is #3 New York City with a @ 225 Price Index score (the least expensive gallon of regular gas costs $3.19/gallon) and the least expensive is #123 Cedar Rapids, Iowa @ 93 ($3.29/gallon). Expatistan’s list indicates that #5 San Francisco @ 214 is the most expensive area in California ($4.49/gallon) in this survey and the least expensive is #27 Walnut Creek @ 162 ($4.67/gallon). Searching the entire state of California, the least expensive gallon of gas can be found in Fresno County @ $3.83/gallon. Of the top 25 most expensive areas worldwide, three are in California (down from four in March); #5 San Francisco @ 214, #8 San Jose @ 199 ($4.69/gallon), and #15 Los Angeles @ 184 ($4.69/gallon). The most expensive area to live in the world is #1 London (England) @ 234 ($5.79/gallon) and the least expensive is #182 Yogyakarta (Indonesia) @ 38 ($2.93/gallon). Santa Barbara is not on the list as Expatistan does not rate it as a major metropolitan area. Local gas prices as low as $4.77/gallon are similar to other California coastal areas. Expatistan’s Cost of Living Index is an interesting way to compare the cost of living in cities around the world: https://www.expatistan.com/cost-of-living/index
According to Realtor.com economist Jiayi Xu’s March 23, 2024 report on the national real estate market: “As the number of fresh listings continues to grow, homebuyers this spring have a wider array of options compared to this time last year. Additionally, the increased listings might put some downward pressure on prices, offering relief to homebuyers. However, with mortgage rates fluctuating between the 6.5% to 7% range since the start of the year, many homebuyers may opt to delay their purchasing plans in anticipation of lower rates, thereby reducing competition. While many sellers continue to feel ‘locked-in’ as mortgage rates remain elevated, those who have been waiting for the opportune moment to list their properties this year should start preparing. According to Realtor.com’s recent analysis, the week of April 14-20 is projected to present the best time to sell. It is the week with the ideal balance of housing market conditions favoring home sellers, more so than any other week throughout the year.” Check out the full report at https://www.realtor.com/research/weekly-housing-trends-view-data-week-mar-23-2024/
Historically the highest Year-to-Date median sale price recorded on the Santa Barbara South Coast was recorded in 2007 at $1,031,500. The median sale price of all residential sales Year-To-Date in 2024 is $1,675,000, down 1% from $1,700,000 in 2023. The median sale price had been hovering near 2007’s historic high for most of 2017, 2018, and 2019, then started an upward climb in 2020, accelerating in 2021 and into the first half of 2022 before leveling off throughout most of 2023. The average sale price of all residential sales Year-To-Date in 2024 is $2,685,450, up 2.9% from $2,608,045 in 2023.
Based on the Santa Barbara Multiple Listing Service data, as of April 1st in the City of Santa Barbara, there were 46 active House/PUD listings (down from 51 in March) and 43 pending sales (up from 30 in March), which equates to a 1.1-month supply (down from 1.7 in March) of listings for Buyers to choose from. Generally, a 1-month supply would indicate the listings would all be sold within one month. A less than 1-month supply of inventory indicates a feverish Seller’s market, a 1-to-2-month supply indicates a heated Seller’s market and a 2-to-4-month supply would be considered a basic Seller’s market where Buyer demand is still high and inventory is scarce. Historically a 4-to-6-month supply of available inventory would indicate a fairly well-balanced, normal market between Buyers and Sellers. More than a 6-month supply is considered to be a Buyer’s market where inventory is plentiful; Buyers will be slower to make decisions as they compare the numerous properties on the market. Based on Santa Barbara Multiple Listing Service data and as of April 1st, Carpinteria/Summerland had a 20-month supply (up from 5.3 in March), Montecito had a 4.1-month supply (down from 5.6 in March), Goleta had a .68-month supply (down from .8 in March) and Hope Ranch had a 10-month supply (the same as in March). These inventory statistics indicate that Goleta remains in a Feverish Seller’s market and Santa Barbara remains in a Heated Seller’s market. Montecito has moved into a Well-Balanced market. Carpinteria/Summerland and Hope Ranch have moved into a Buyer’s market. With a combined total of 72 House/PUD pending sales (up from 55 in March) and 122 active listings (up from 119 in March) along the South Coast of Santa Barbara County, there is a only a 1.7-month supply (down from 2.2 in March) of House/PUD listings from which Buyers can choose. With a combined total of 21 Condominium pending sales (same as in March) and only 33 active listings (down from 34 in March) on the South Coast of Santa Barbara County, there is a 1.6-month supply (same as in March) of Condominium listings from which Buyers can choose. The total South Coast of Santa Barbara County market is in a state of transition with property values remaining static for most of 2023 and now into the first months of 2024. While today’s Buyers are now seeing multiple-offer situations once again, they will pay a premium price for a home with great amenities and in a great location. People still want to live along the Santa Barbara South Coast to enjoy the Mediterranean climate and our casual lifestyle.
While concerns about the pandemic’s economic impact have diminished, there are several other concerns for many Buyers and Sellers. These include the wars in Ukraine and the Middle East, continued tensions in other parts of the Middle East, rising insurance premiums, higher mortgage interest rates, and still the possibility of a recession or a “soft landing”. Now a major concern for Buyers and Sellers is the scarcity of homeowners’ insurance coverage, especially since State Farm, Nationwide, Kemper, and Allstate have refused to issue new and are cancelling existing home insurance policies ( http://enewspaper.latimes.com/infinity/article_share.aspx?guid=562195b2-67c8-48b1-96f6-3c042e2ffd35 ). California’s Proposition 19 allows homeowners aged 55+ to transfer their existing real estate tax base to a home anywhere in the State; this newer law may encourage some older Sellers who wish to sell their current homes and downsize. Lack of inventory means high demand and therefore higher prices, so over many years there has been a surge in property values on the Santa Barbara South Coast. While market corrections may still negatively impact property values on the Santa Barbara South Coast, the impact is expected to be less severe compared to many other areas in the state and country. New listings in 2024 may remain on the market a bit longer than in 2023, but each week we are still seeing multiple offers on certain well-priced listings. Home values in the Santa Barbara South Coast Real Estate Market continue to be positively affected by supply and demand dynamics due to our market’s persistent low listing inventory; I expect this value dynamic to continue into the foreseeable future.
Review the attached list of the 100 properties sold on the Santa Barbara South Coast in March 2024 and feel free to contact me for information on specific sales in our area.
Stan Tabler, CRS, GRI, ABR, GREEN
Compass
801 Chapala Street
Santa Barbara, CA 93101
805.689.2305
CalBRE Brokers License #00774377 since 1980