
The decision to purchase real estate or to place your home for sale in the Santa Barbara real estate market can be one of the biggest you and your family will make at any given time. This decision can be made easier if you are adequately informed about the buying and selling process, the local real estate market and the neighborhoods and communities in which you are interested. As a local real estate professional with more than thirty years of experience helping buyers and sellers just like you, it would be my great pleasure to introduce you to the Santa Barbara Real Estate Services I offer to both buyers and sellers.
For sake of simplicity, buying a home is a three-step process: finding the right community, finding the right home and negotiating the best contract terms. For your convenience, I have compiled a wealth of information on local communities and their real estate trends as well as provided you access to the search the entire Santa Barbara MLS to view available properties. Once we have narrowed down the ideal community and the right home, I will use my many years of experience and expertise and my Santa Barbara Real Estate Services to negotiate the contract terms to suit your needs and to exceed your expectations.
For sellers, I believe you will find my commitment to untiring communication and service, masterful marketing and negotiation skills to be most refreshing. Resulting from years of extensive experience and research, a superior ability to anticipate problems and solve them and unsurpassed ethics and professionalism, you will find these qualities will help your home sell quickly and for its highest dollar.
Whether you are moving across town or across the country, it would be my great pleasure to assist you with all your housing needs and to share my Santa Barbara Real Estate Services with you and your family. Please feel free to browse my Santa Barbara Home Buying and Selling Tips at your leisure and do not hesitate to contact me, Stan Tabler at your convenience. I look forward to hearing from you soon and assisting you with all your real estate goals, big and small.
Santa Barbara South Coast Real Estate Update
July 12, 2026
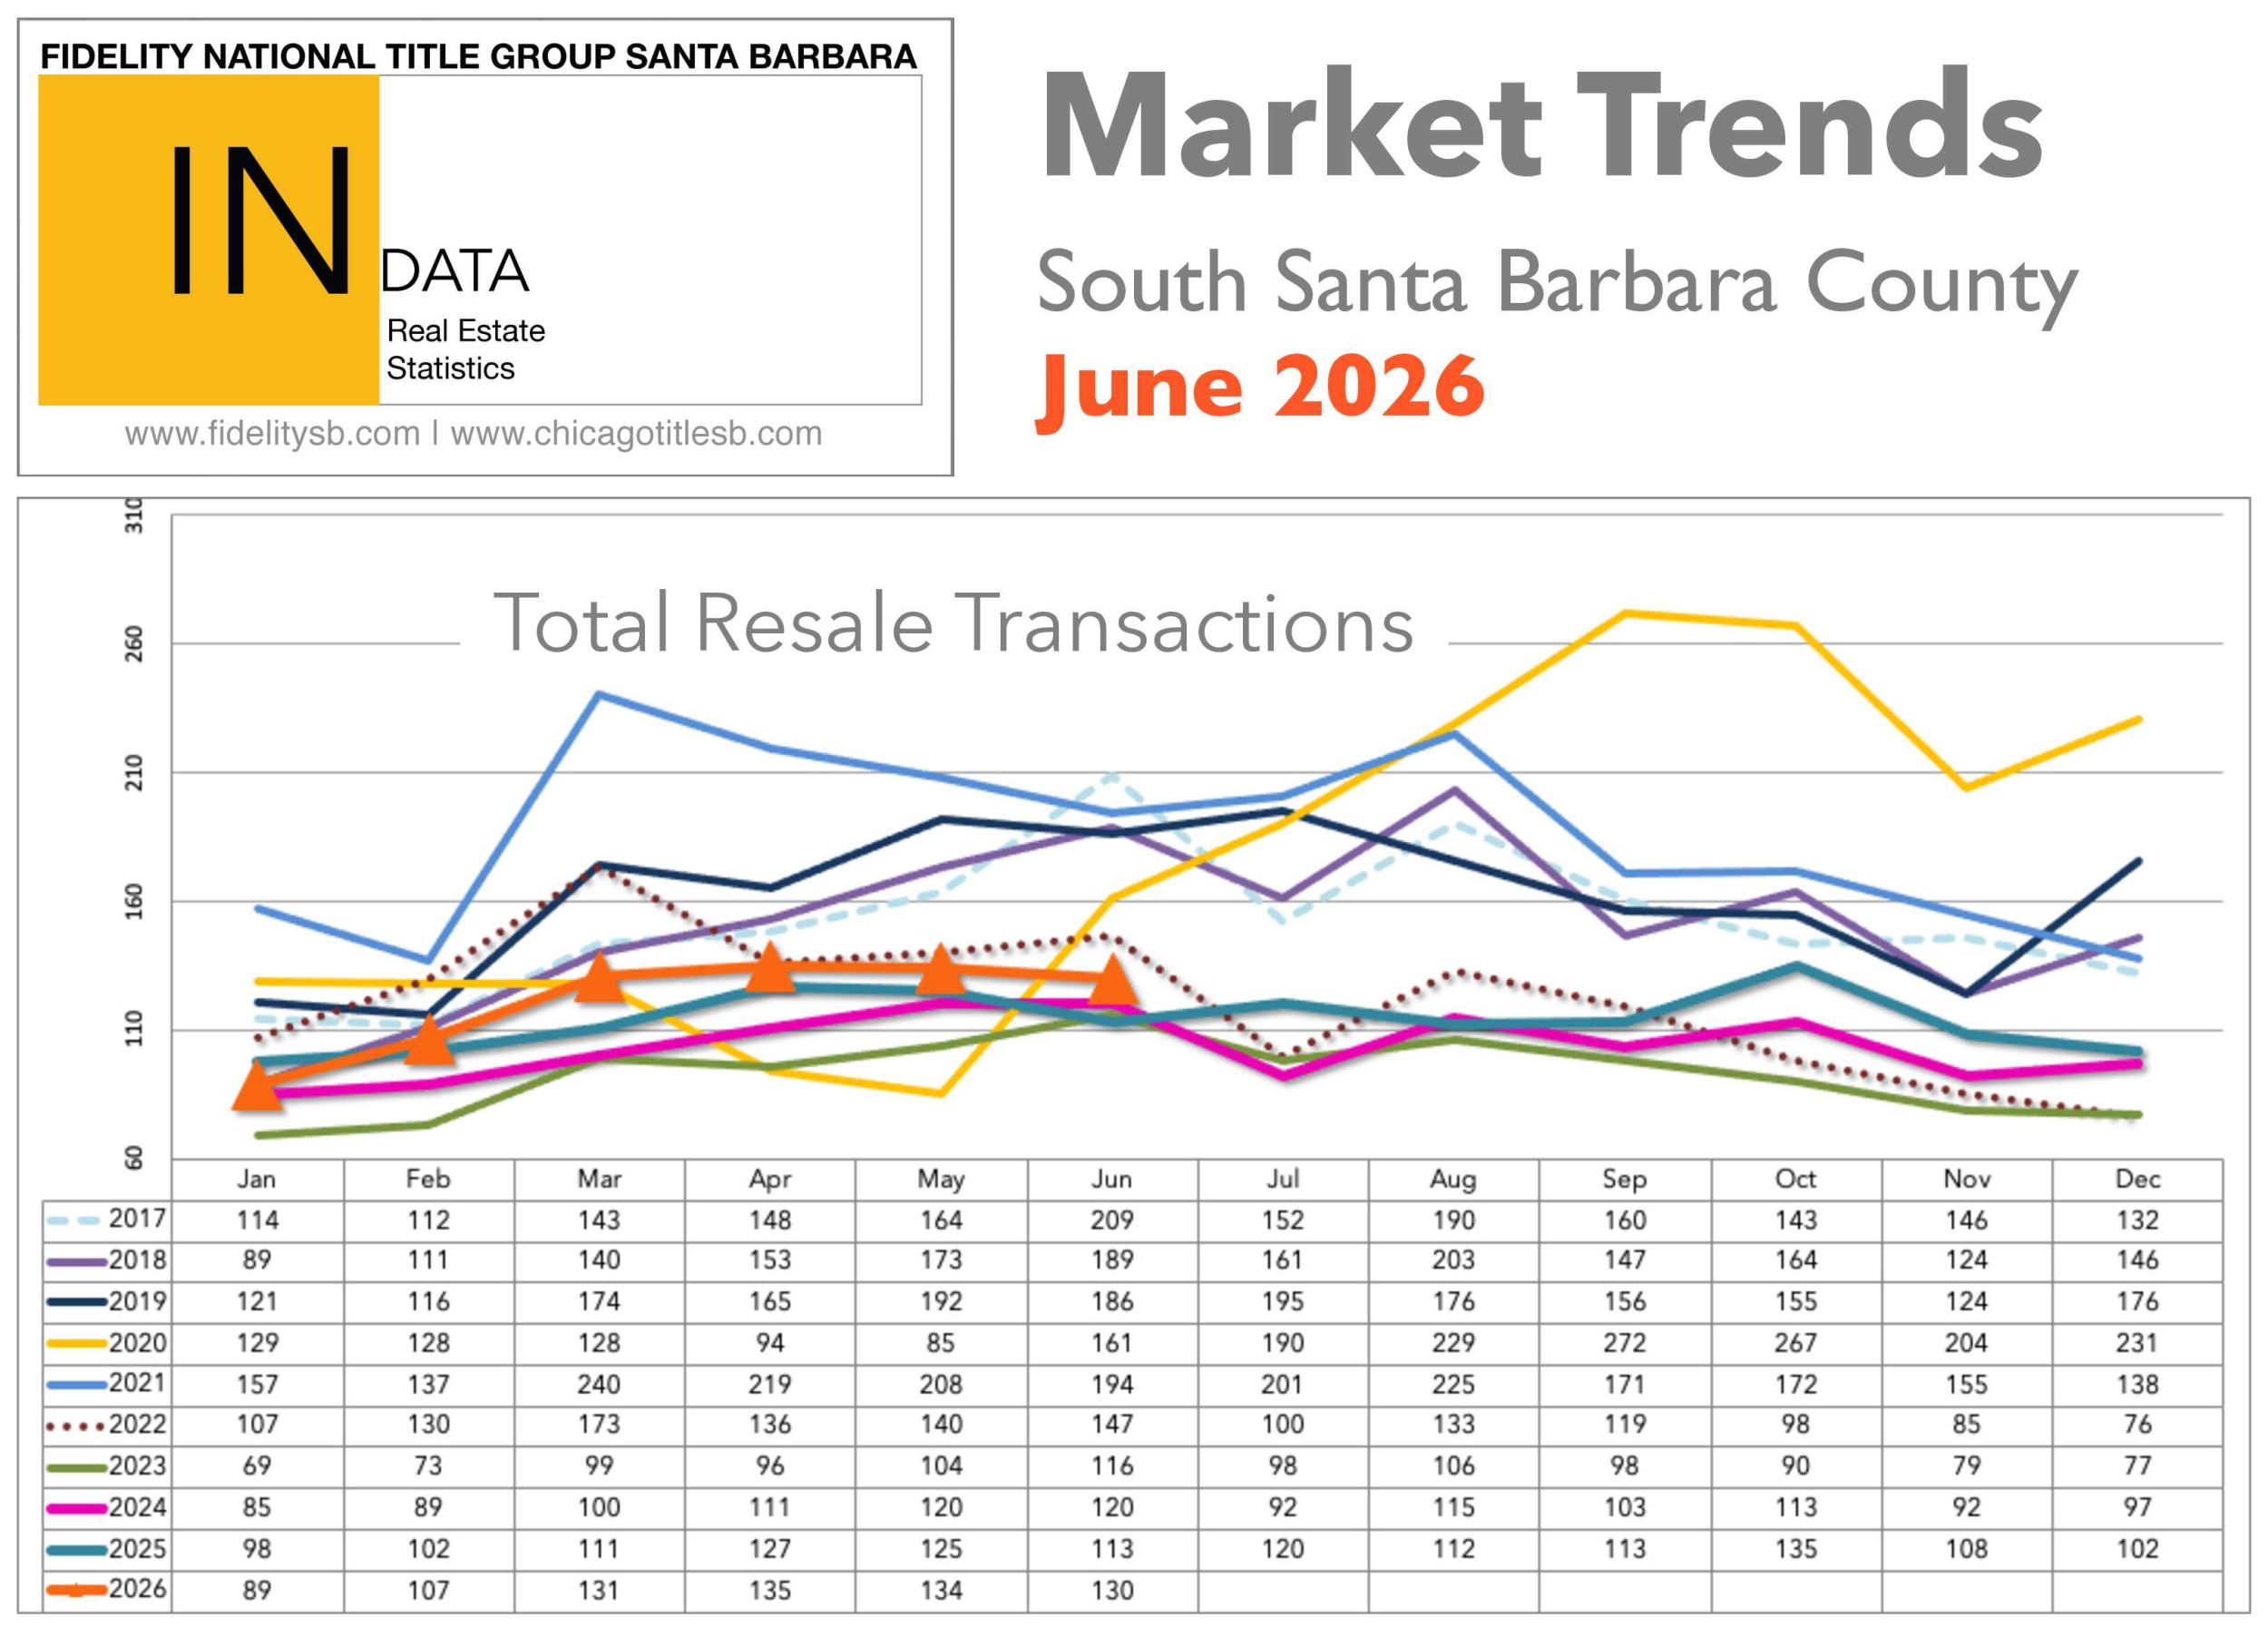
According to data from the County Recorder’s Office as reported by Fidelity National Title, the number of residential property sales on the Santa Barbara South Coast increased by 15% in June 2026, with 130 sales as compared with June 2025. Of these 130 sales, there were 91 House or Planned Unit Development (PUD) sales, up from 84 in June 2025; the median sale price of these House/PUD sales was $2,110,000, down 1% from June 2025, and the average sale price was $3,731,648, up 14% from June 2025. Of these 130 sales, there were 39 Condominium sales, up from 29 in June 2025; the median sale price of these Condominium sales was $1,085,000, the same as in June 2025, and the average sale price was $1,449,387, up 1% from June 2025.
Regional Highlights
Carpinteria had 15 residential sales reported in June 2026, the same number of sales as in May 2026. There were 8 House/PUD sales, the same number as in May; the median sale price of these House/PUD sales was $2,212,500, and the average price was $6,534,749. There were 7 Condominium sales, the same number as in May; the median sale price of these Condominium sales was $795,000, and the average sale price was $935,929. In June 2026, the lowest-priced Carpinteria sale was a Condominium on Hickory Street @ $645,000, and the highest-priced sale was an oceanfront Estate on Padaro Lane @ $33,333,333.
Summerland had 1 residential sale reported in June 2026, the same as in May. The 1 House sale was on Emerson Street which sold for $3,195,000.
Montecito had 17 residential sales reported in June 2026, the same number as in May. There were 14 House/PUD sales, down from 15 in May; the median sale price of these House/PUD sales was $8,550,000, and the average price was $8,846,268. There were 3 Condominium sales, up from 2 in May; the median sale price of these Condominium sales was $3,500,000 and the average sale price was $4,596,667. In June 2026, the lowest-priced Montecito sale was a Condominium on Plaza De Sonadores @ $2,390,000, and the highest-priced sale was an ocean front Estate on Edgecliff Lane @ $29,995,000.
The City of Santa Barbara had 57 residential sales reported in June 2026, down from 68 in May. There were 40 House/PUD sales, down from 51 in May; the median sale price of these House/PUD sales was $1,700,000, and the average price was $2,103,512. There were 17 Condominium sales, the same number as in May; the median sale price of these Condominium sales was $1,237,500 and the average sale price was $1,509,853. In June 2026, the lowest-priced Santa Barbara sale was a Condominium on San Andres Street @ $414,000, and the highest-priced sale was a House on Yankee Farm Road @ $4,950,000.
Hope Ranch had 2 residential sales reported in June 2026, the same number as in May. The median and average sale price of these 2 House/Estate sales was $10,600,000. There are no Condominiums in Hope Ranch. In June 2026, the lowest-priced Hope Ranch sale was a House on Via Hierba @ $4,500,000, and the highest-priced sale was an Estate on La Ladera Road @ $16,700,000.
Goleta had 38 residential sales reported in June 2026, up from 31 in May. There were 26 House/PUD sales, up from 23 in May; the median sale price of these House/PUD sales was $1,847,500, and the average price was $2,112,250. There were 12 Condominium sales, up from 8 in May; the median sale price of these Condominium sales was $755,000 and the average sale price was $876,425. In June 2026, the lowest-priced Goleta sale was a Condominium on Camino Del Remedio @ $450,000, and the highest-priced sale was a House on Camino Molinero @ $4,000,000.
Analysis
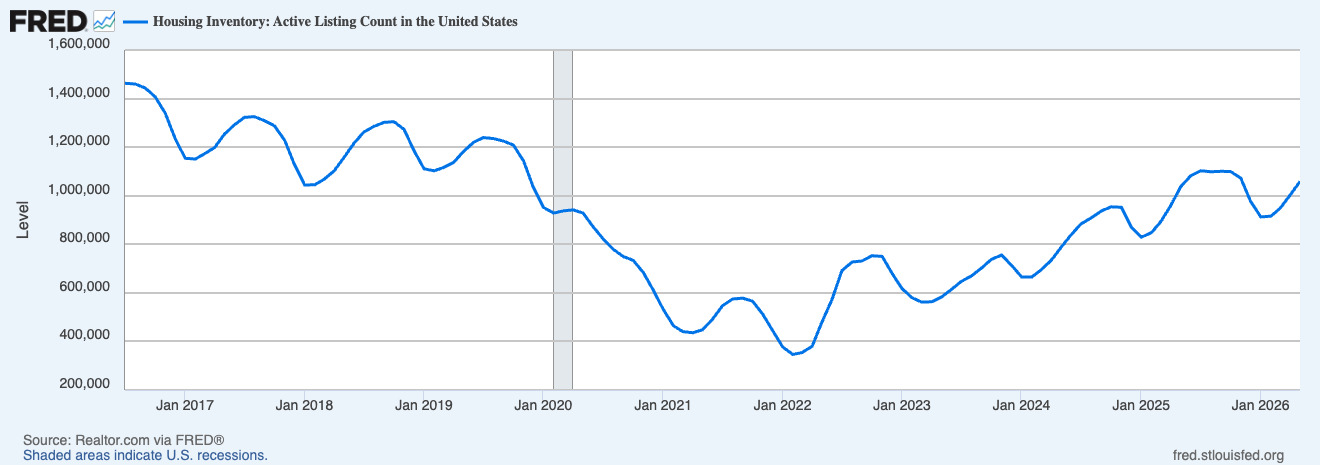
As of July 1st in the Santa Barbara Multiple Listing Service (MLS), there were 206 available House/PUD listings (up from 191 on June 1st) and 62 available Condominium listings (up from 60 on June 1st) along the Santa Barbara South Coast. The lack of housing inventory for sale has loosened up a bit since last year, but it has continued to put upward pressure on housing values. Compare our current low supply levels to the years 2007 through 2011, when the total number of available listings that Buyers could choose from fluctuated between 734 and 1,026. Nine years ago, in July 2017, there were 369 available House/PUD listings (79% more than today) and 104 available Condominium listings (68% more than today) on the market. The highest number of available listings along the Santa Barbara South Coast was recorded in June 1992, when there were an amazing 1,297 available!
While the number of days that listings stay on the market before entering escrow has risen and the competition among Buyers creating bidding wars has diminished a bit, it has not totally disappeared. According to the MLS sales data, there were a total of 119 residential sales in June on the South Coast of Santa Barbara County, down from 130 in May. According to the County Recorder, there were 130 residential sales in June, so 11 sale transactions were private and not reported to the MLS. Of the 119 MLS sales, 26% closed above the original asking price (up from 24% in May), 9% closed at the original asking price (down from 19% in May), and 65% closed for less than the original asking price (up from 57% in May). After analyzing the June MLS sales data, there were 13 listings (up from 7 in May) which sold $100,000+ above their original asking prices; these listings were Via Salerno which sold $255,000 above asking, Zink Avenue which sold $250,000 above asking, Via Los Padres and Huntington Drive both which sold $205,000 above asking, Glenbrook Street which sold $198,500 above asking, Burtis Street which sold $179,000 above asking, Sterling Way which sold $161,000 above asking, Flora Vista Drive and Via Ravenna both which sold $155,000 over asking, El Carro Lane which sold $129,655 over asking, Paseo Palmilla which sold $126,000 over asking, Clearview Road which sold $120,000 over asking, Toro Canyon Road which sold $115,000 over asking and Kenwood Road which sold $100,000 above asking. Nationally, the percentage of May sales above the asking price has averaged 26-30% as compared to the South Coast of Santa Barbara’s 26%. If you think Buyer competition is high in Santa Barbara, think again: In San Francisco, bidding wars are very intense. The number of homes sold for at least $1,000,000 over the asking price surged from less than 10 in May to more than 40 in June!
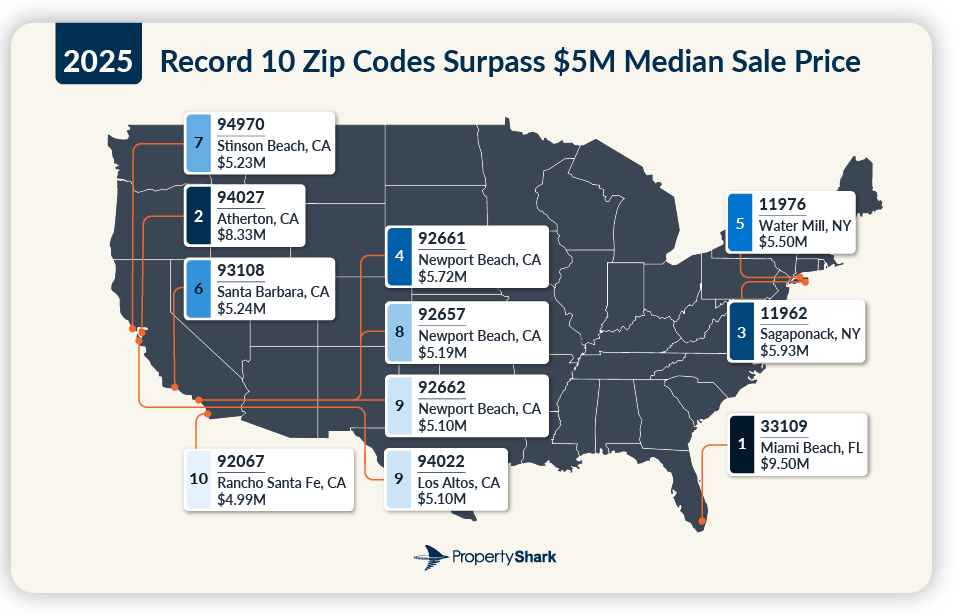
Of the 130 residential sales in June 2026, 109 sold over $1,000,000, which equates to 84% of the total sales, down from 87% May. As a comparison, just 12% of listings nationwide are priced above $1,000,000. The South Coast of Santa Barbara County is not an inexpensive place to purchase real estate compared to other areas of the United States, but many people will pay more to live in Santa Barbara. According to Property Shark’s survey, California had 7 of the 10 most expensive median-priced ZIP codes in the United States. Montecito’s 93108 ZIP code came in at #5 with a median sale price of $6,995,000. The #1 spot is held by Fisher Island (off the coast of Miami) where the median sale price is $11,925,000, which is 27 times higher than the U.S. median sale price. https://www.propertyshark.com/Real-Estate-Reports/most-expensive-zip-codes-in-the-us/
Another validation of Santa Barbara’s popularity, no matter the cost, the New York Post’s survey ranked the most expensive cities in the US to visit as a tourist and the winner is #1 Aspen where a three-day trip for two costs $2,708. Closely followed is #2 Santa Barbara where a three-day trip for two costs $2,446. Filling out the top five on the list were Anchorage, Bar Harbor, and Fairbanks. The last (#55) on the list and the least expensive tourist destination for vacationers was Clearwater, Florida, where a three-day trip for two costs $1,630, 40% less than Aspen. https://nypost.com/2025/07/04/lifestyle/most-expensive-tourist-destinations-in-the-us-in-2025/
Another reason Santa Barbara is so sought after is its local educational system as University of California Santa Barbara ranked as #91 out of 2,250 universities worldwide, and Santa Barbara City College ranked #1 out of the 116 Community Colleges in California.
https://www.usnews.com/education/best-global-universities/rankings and
https://bold.org/blog/best-community-colleges-in-california
The new Federal Reserve Chairman, Kevin Warsh, in comments on July1st at the ECB Forum on Central Banking, declined to give any signal as to what the central bank may do at its meeting later this month, but did note that inflation was too elevated. “We’re all in the price stability business, that might not be our only business, but if there was a common thing I heard over the last couple of days, it was open-mindedness on these questions of AI, open-mindedness on productivity, but we’ve all looked around, and we’ve seen that prices are too high,” Warsh told CNBC’s Sara Eisen during the panel in Sintra, Portugal. “My hope, my aspiration, is that nine-12 months from now we’re going to be using new technologies to understand what’s happening in the real economy in a contemporaneous real-time way that positions us as central bankers to make better decisions.” https://www.cnbc.com/2026/07/01/kevin-warsh-ecb-forum-live-updates.html

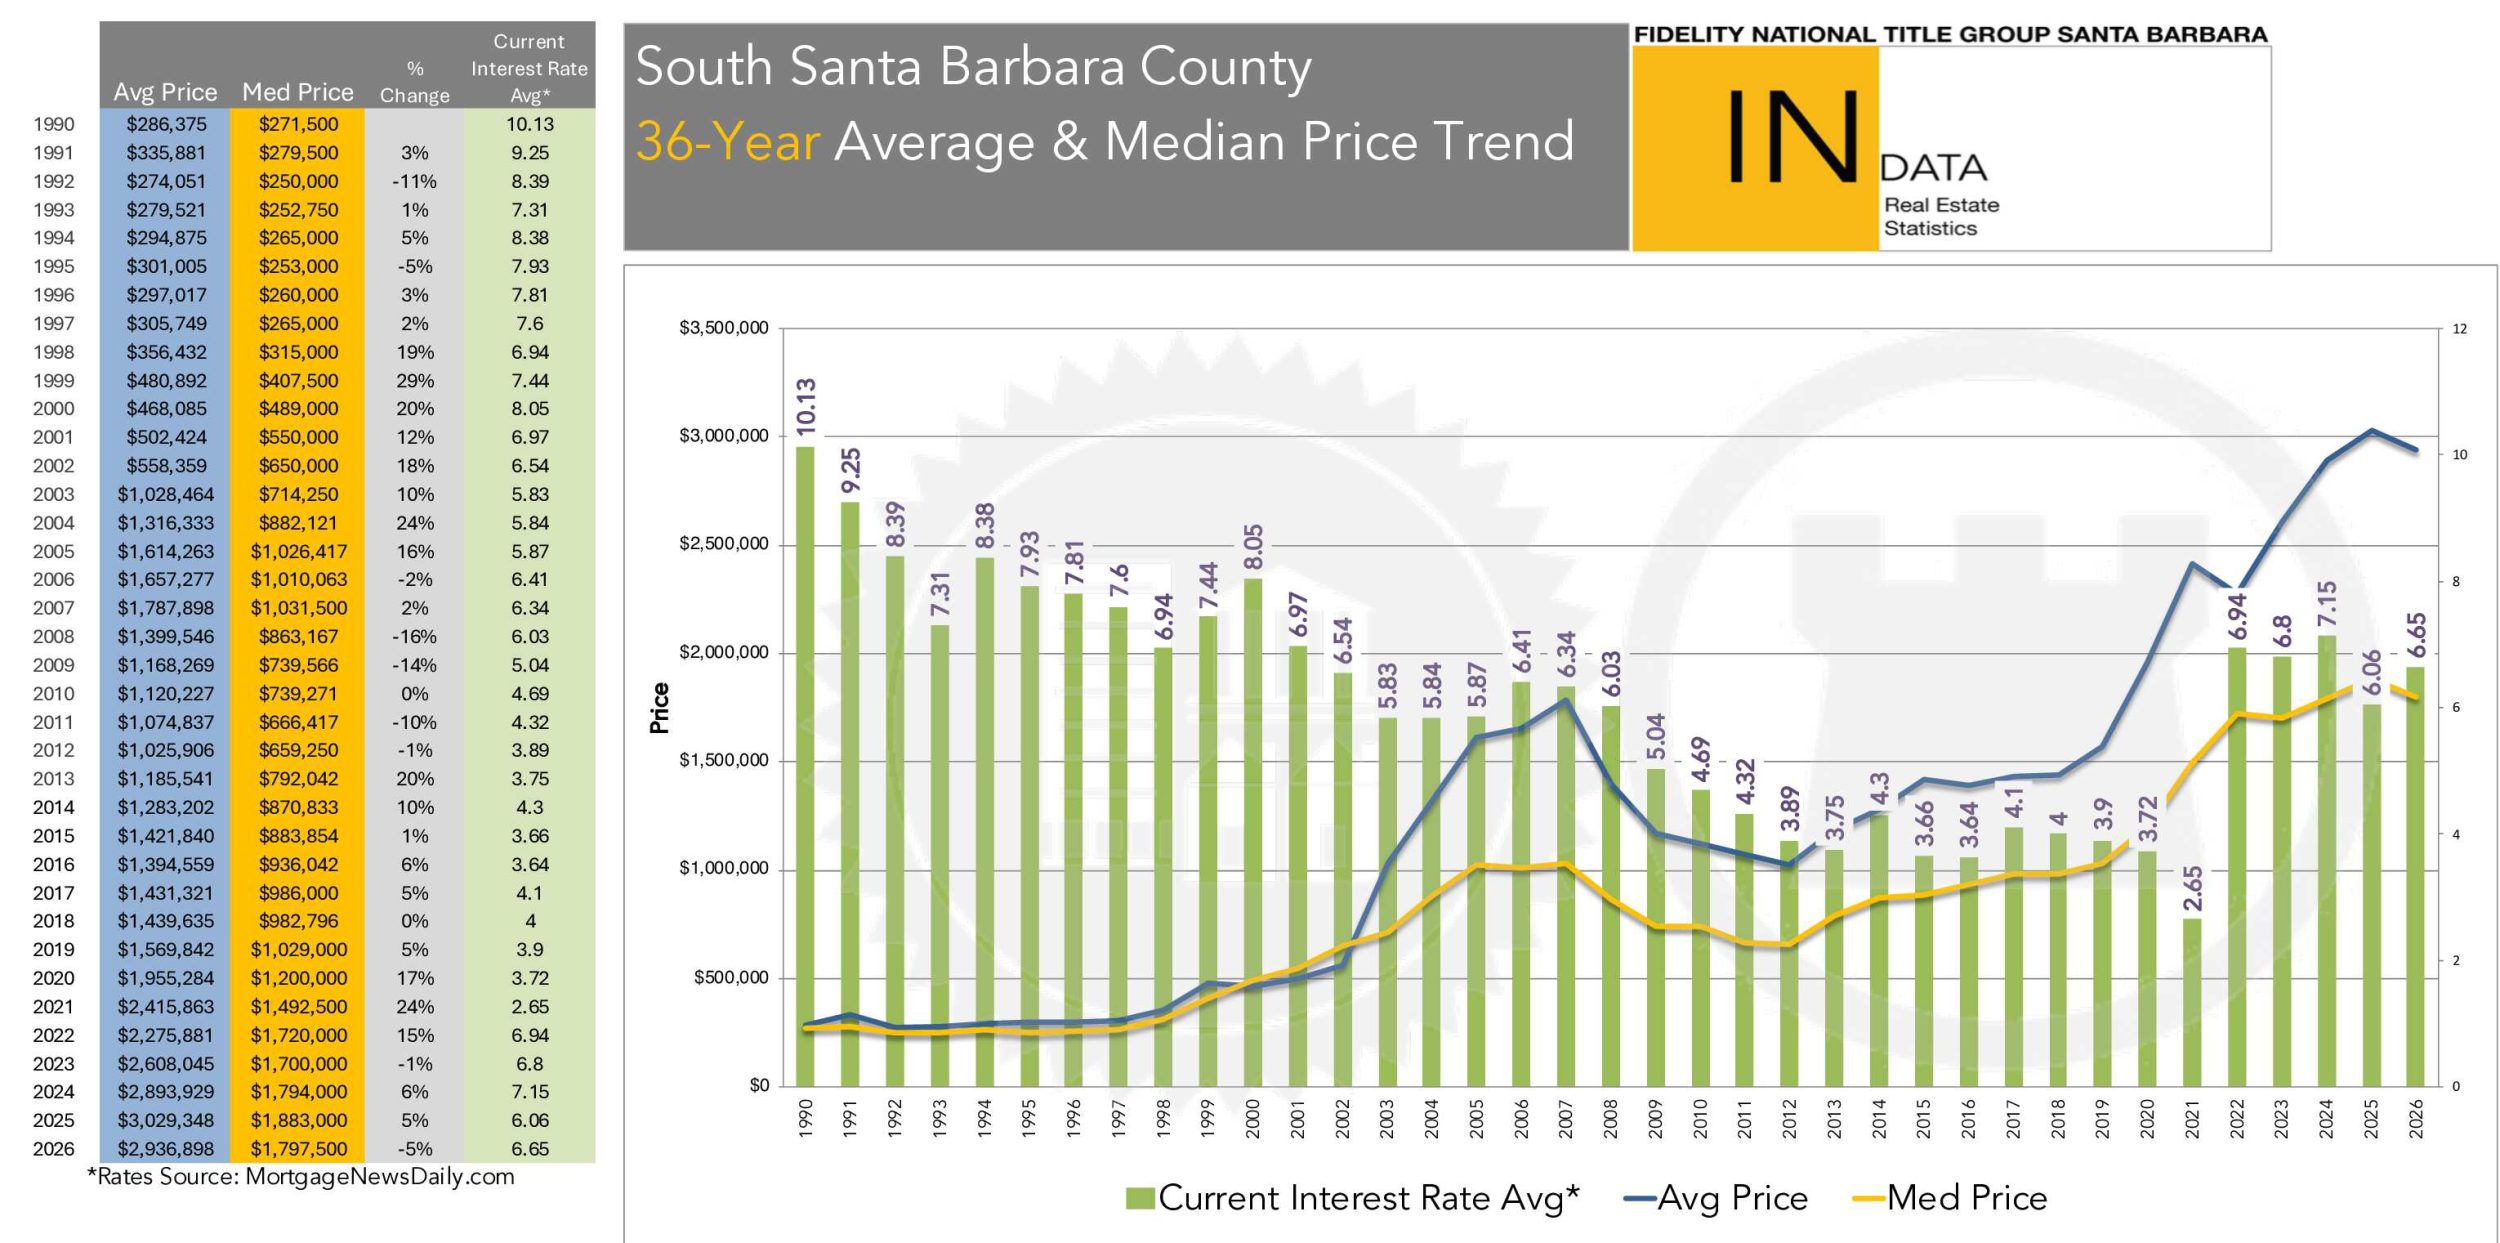
Since the beginning of 2022, 30-year mortgage interest rates have doubled, but started easing downward in 2024, and were 6.43% as of July 1st, down from 6.53% on June 1st. Historically, the lowest 30-year mortgage interest rate since 1970 was recorded in February 2021 at 2.65% and that low rate was matched in July 2021 during the COVID pandemic. If Buyers are expecting 3% or even low 5% mortgage rates to return to buy a home, they are waiting for an anomaly and should wait no longer. The highest historical 30-year fixed-rate interest rate was recorded in 1981 @ 18.63%. The average 30-year mortgage rate over the last 50 years has been 7.70%, so current rates are still below that average. Mortgage rates of 8.03% in October 2023 were at a 23-year high following all-time lows reached just three years before, highlighting the effect that financing costs have on the housing market. The payment on a $913,100 mortgage in 1981 would have been $13,423/month, the payment in June 2021 would have been $3,679/month, and as of July 1st, the payment would be $5,729/month. As an alternative to obtaining a mortgage, in June 2026, 36% of South Coast Buyers purchased homes with cash, down from 48% in May.

The NAHB/Wells Fargo Housing Market Index (HMI), which tracks US homebuilder confidence in the market for newly built single-family homes, fell to 35 in June 2026, down from 37 in May and slightly below market expectations of 36. Within the report, current sales conditions declined by two points to 38, while sales expectations for the next six months remained unchanged at 45. Buyer traffic also held steady at a weak level of 25, signaling persistently soft demand. The survey also highlighted continued reliance on pricing strategies. 35% of builders reported cutting prices in June, up from 32% in May. The average price reduction remained at 6%, unchanged month-over-month. https://tradingeconomics.com/united-states/nahb-housing-market-index
As for the worldwide cost of living as of July 1st, Expatistan compiled an index of 97 major worldwide metropolitan areas. According to the index in the United States, the most expensive metropolitan area to live in is #3 Washington DC with a 186 Price Index score, and where the average cost of a gallon of regular gas is $4.08. The least expensive area to live in the United States is Cedar Rapids, Iowa @ 79 ($3.57/gallon.) Of the top 25 most expensive areas on the worldwide list, two are in California: #6 San Diego @ 178 ($5.46/gallon) and #7 Los Angeles @ 177 ($5.41/gallon). According to the index, the least expensive area to live in the world is #97 Yogyakarta (Indonesia) @ 30 ($3.57/gallon). The average gas price in Santa Barbara County is $5.54/gallon, while the lowest California county average cost of gas is in Sutter County at $5.11/gallon. According to AAA, the average cost of a gallon of gas in California is $5.40/gallon, while the National average is $3.84/gallon. The most expensive gas in California is sold in Gorda By The Sea on the Big Sur Coast, where a gallon of gas will set you back $9.99. If you think that we have high prices, check London where gas costs $7.60/gallon and Hong Kong where gas costs $15.35/gallon! Expatistan’s Cost of Living Index is an interesting way to compare the cost of living in cities around the world. https://www.expatistan.com/cost-of-living/index
The Conference Board Consumer Confidence Index® inched up by 0.6 points to 91.2 (1985=100) in June, up from a downwardly revised 90.6 in May. “Consumer confidence inched up in June as falling oil prices in recent weeks provided some relief to consumer inflation fears,” said Dana M. Peterson, Chief Economist, The Conference Board. “Consumer appraisals of current business conditions were slightly more positive compared to last month. However, perceptions of the current labor market softened measurably as the percentage of consumers saying jobs were ‘hard to get’ rose to 22.5%, the highest level since January 2021 (22.8%). Moreover, consumers anticipate little change in the labor market six months from now. This was offset by improving expectations for business conditions and incomes.” https://www.conference-board.org/topics/consumer-confidence

According to the University of Michigan’s Surveys of Consumers as reported on June 17th “Consumer sentiment confirmed its early-month reading, rising about 10% above May as gas prices moderated. Increases were seen across income, wealth, and political affiliation. Year-ahead inflation expectations inched down from 4.8% in May to a still-elevated 4.6% this month. The current reading substantially exceeds the 3.4% reading seen in February before the Iran conflict began. Long-run inflation expectations fell back from 3.9% last month to 3.3% in June, remaining a bit higher than the 2.8% to 3.2% range seen in 2024.” https://www.sca.isr.umich.edu/

Historically, the highest Year-to-Date median sale price on the Santa Barbara South Coast was recorded in 2007 at $1,031,500, but that high mark is now ancient history. The median sale price of all residential 2026 sales Year-To-Date as of July 1st was $1,797,500, down 5% from 2025, and the average sales price was $2,936,898. While the median sale price was hovering near 2007’s historic high for most of 2017, 2018, and 2019, it started its upward climb in 2020, accelerating in 2021 and into the first half of 2022 before leveling off throughout and declining 1% in 2023. There have been no double-digit price increases in the median sales price since a 17% increase in 2020, 24% in 2021 and 15% in 2022.
Based on the Santa Barbara Multiple Listing Service data, as of July 1st in the City of Santa Barbara, there were 75 active House/PUD listings (up from 72 on June 1st) and 35 pending sales (down from 36 on June 1st) which equates to a 2.1-month supply (up from 2 on June 1st) of listings for Buyers to choose from in the City of Santa Barbara. Generally, a 1-month supply would indicate the listings would be sold within one month. A less than 1-month supply of inventory indicates a feverish Seller’s market, a 1-to-2-month supply indicates a heated Seller’s market, and a 2-to-4-month supply is considered a basic Seller’s market where Buyer demand is still high, and inventory is scarce. Historically, a 4-to-6-month supply of available inventory indicates a Balanced market. More than a 6-month supply indicates a Buyer’s market where inventory is plentiful, with Buyers being slower to make decisions as they compare numerous properties on the market. As of July 1st, Carpinteria/Summerland has a 4.1-month supply (up from 1.5 on June 1st), Montecito has a 7.3-month supply (up from 4.4 on June 1st), Hope Ranch has a 4-month supply (up from 3.3 on June 1st), and Goleta has a 1.5-month supply (down from 1.6 on June 1st). Goleta remains in a heated Seller’s market. Carpinteria/Summerland and Hope Ranch have moved into balanced markets. Montecito is in a Buyer’s market. Santa Barbara remains in a basic Seller’s market. With a combined total of 75 House/PUD pending sales (down from 83 on June 1st) and 206 active listings (up from 191 on June 1st) along the South Coast of Santa Barbara County, there is a 2.8-month supply (up from 2.3 on June 1st) of House/PUD listings from which Buyers can choose. By removing the 70 higher-valued House/PUD listings in Montecito and Hope Ranch along with their 11 pending sales from the equation, there is only a 2.1-month supply (up from 1.8 on June 1st) from which Buyers can choose on the South Coast of Santa Barbara County. With a combined total of 27 Condominium pending sales (up from 21 on June 1st) and 62 active listings (up from 60 on June 1st), there is a 2.3-month supply (down from 2.9 on June 1st) of Condominium listings from which Buyers can choose.
There are many concerns for Buyers and Sellers. These include the wars in the Middle East and Ukraine, the rising price of gas, continued worldwide geopolitical tensions, inflation, insurance premium volatility, mortgage interest rates, health insurance rates, geopolitical tensions, and how many other administration economic policies are confusing to our trading partners. Also, a major concern for Buyers and Sellers is the scarcity and cost of homeowners’ insurance coverage, especially since State Farm, Nationwide, Kemper, Marine America, Trans-Pacific, Allstate and others have refused to issue new policies in California and are not renewing existing home insurance policies. Buyers are increasingly resorting to the California Fair Plan for insurance coverage as the last resort, whose rates are rumored to be rising by 29% later this year. Sellers should be aware that Buyers are being more disciplined, homes are taking longer to sell, and pricing strategy matters more than ever.
California’s Proposition 19 now allows homeowners aged 55+ to transfer their existing real estate tax base to a home anywhere in California; this law encourages some older Sellers who wish to sell their current homes and downsize. The imbalance between Santa Barbara’s low housing supply and high demand is more pronounced than in most national cities, so over the years, there has been a surge in local property values. While market corrections may still negatively impact property values on the Santa Barbara South Coast, the impact is expected to be less severe compared to many other areas in the state and country. New 2026 listings may have remained on the market a bit longer than in 2025, but they continue to sell. Home values in the Santa Barbara South Coast Real Estate Market continue to be supported by supply and demand dynamics due to our current market’s persistent low listing inventory. Pre-pandemic House/PUD active listings as of July2019 totaled 458; as of July 1st 2026, there are now 206 active listings, which equates to 55% fewer active listings than in 2019.
Review the attached list of the 130 properties sold on the Santa Barbara South Coast in June 2026, and contact me for information on specific sales in our area.
Stan Tabler, CRS, GRI, ABR, GREEN
Compass
801 Chapala Street
Santa Barbara, CA 93101
805.689.2305
DRE #00774377 since 1980
Leave a Reply