Santa Barbara South Coast Real Estate Update
January 10, 2026
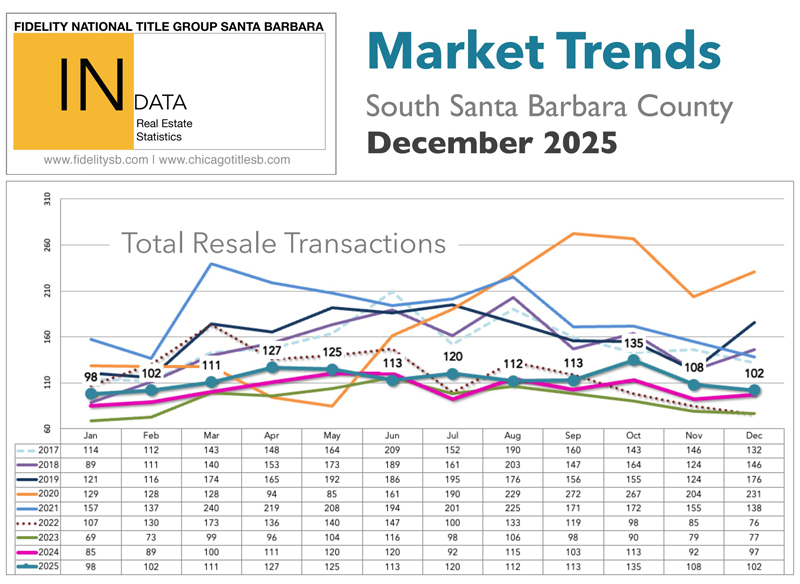
According to data from the County Recorder’s Office by way of Fidelity National Title, the number of residential property sales on the Santa Barbara South Coast increased by 5% in December 2025, with 102 sales as compared with December 2024. Of these 102 sales, 70 were Houses or Planned Unit Developments (PUDs), the same number as in December 2024; the median sale price of these House/PUD sales was $1,919,993, down 5% from 2024, and the average sale price was $2,564,531, down 12% from 2024. There were 32 Condominium sales in December 2025, up 19% from December 2024; the median sale price of these Condominium sales was $1,075,000, up 20% from 2024, and the average sale price was $1,298,358, up 22% from 2024.
Carpinteria had 11 residential sales in December 2025, up from 8 in November. There were 8 House/PUD sales, up from 6 in November; the median sale price of these House/PUD sales was $1,425,000, and the average price was $2,670,250. There were 3 Condominium sales, up from 2 in December; the median sale price of these Condominium sales was $900,000 and the average sale price was $1,080,000. In December 2025, the lowest-priced Carpinteria sale was a Condominium on Birch Street @ $680,000, and the highest-priced sale was an oceanfront House on Sand Point Road @ $11,650,000.
Summerland had 1 residential sale in December 2025, down from 3 in November. The only sale was a House on Lillie Avenue @ $2,700,000.
Montecito had 11 residential sales in December 2025, down from 15 in November. There were 9 House/PUD sales, down from 15 in November; the median sale price of these House/PUD sales was $3,990,000, and the average price was $4,834,444. There were 2 Condominium sales, up from 0 in December; the median and average sale price of these Condominium sales was $4,125,000. In December 2025, the lowest-priced Montecito sale was a House on Sierra Vista Road @ $2,000,000, and the highest-priced sale was an Estate on East Valley Road @ $8,350,000.
Santa Barbara had 44 residential sales in December 2025, down from 53 in November. There were 26 House/PUD sales, down from 39 in November; the median sale price of these House/PUD sales was $2,197,500, and the average price was $2,233,933. There were 18 Condominium sales, up from 14 in December; the median sale price of these Condominium sales was $1,122,000 and the average sale price was $1,209,528. In December 2025, the lowest-priced Santa Barbara sale was a Condominium on Miramonte Drive @ $727,500, and the highest-priced sale was a House on E Padre Street @ $4,150,000.
Hope Ranch had 1 sale in December 2025, up from 0 in November. The only sale was an oceanfront Estate on Marina Drive @ $10,750,000.
Goleta had 34 residential sales in December 2025, up from 29 in November. There were 25 House/PUD sales, up from 23 in November; the median sale price of these House/PUD sales was $1,577,500, and the average price was $1,724,517. There were 9 Condominium sales, up from 6 in December; the median sale price of these Condominium sales was $853,000 and the average sale price was $920,661. In December 2025, the lowest-priced Goleta sale was a Condominium on Mathilda Drive @ $550,000, and the highest-priced sale was a PUD on Diamond Crest Court @ $3,150,000.
Analysis
As of January 1st in the Santa Barbara Multiple Listing Service (MLS), there were 147 available House/PUD listings (down from 196 on December 1st) and 46 available Condominium listings (down from 64 on December 1st) along the Santa Barbara South Coast. The lack of housing inventory available for sale has loosened up a bit since last year, but it has continued to put upward pressure on housing values. Compare our current supply levels to the years 2007 through 2011, when the total number of available listings for Buyers to choose from fluctuated between 734 and 1,026. Historically, the highest number of available listings along the Santa Barbara South Coast was recorded in June 1992, when there were an amazing 1,297 available!
While the number of days that listings stay on the market before entering escrow has risen, the competition among Buyers creating bidding wars has diminished, although it has not totally disappeared. According to the Santa Barbara Multiple Listing Service (MLS) sales data, there were 91 residential sales in December on the South Coast of Santa Barbara County, down from 104 in November. The County Recorder reported 102 total sales in December, indicating that 11 private sales did not register in the MLS. Of the 91 MLS sales, 15% closed above the original asking price (down from 18% in November), 19% closed at the original asking price (up from 16% in November), and 68% closed for less than the original asking price (down from 66% in November). After analyzing the December sales data, there were 4 listings (the same number as in December) which sold $100,000+ over their original asking prices; these listings were Palo Alto Drive which sold $181,000 over asking price, Vista De La Cumbre which sold $155,000 over asking, Arundel Road which sold $144,500 over asking, and Sunset Drive which sold $100,000 over asking. Nationally, the percentage of sales over the asking price has hovered around 28% as compared to the South Coast of Santa Barbara’s 15% December sales ratio. If you think Buyer competition is high in Santa Barbara, data from Silicon Valley indicate that 22 properties sold for $200,000+ above their list prices in December! Two of those properties snagged an extra $600,000 in that rebalancing market. Multiple offers are still common.

Of the 102 residential sales in December 2025, 86 sold over $1,000,000, which equates to 84% of the total sales, down from 89% November. The South Coast of Santa Barbara is not an inexpensive place to purchase real estate compared to other areas of the United States, but many people will pay more to live in Santa Barbara. According to Property Shark’s survey, California had 7 of the 10 most expensive median-priced ZIP codes in the United States. Montecito’s 93108 ZIP code came in at #5 with a median sale price of $6,995,000. The #1 spot is held by Fisher Island (off the coast of Miami) where the median sale price is $11,925,000, which is 27 times higher than the U.S. median sale price. To review the whole report: https://www.propertyshark.com/Real-Estate-Reports/most-expensive-zip-codes-in-the-us/

Another verification of Santa Barbara’s popularity, no matter the cost, the New York Post’s survey ranked the most expensive cities in the US to visit as a tourist and the winner is #1 Aspen where a three-day trip for two costs $2,708! Closely followed is #2 Santa Barbara where a three-day trip for two costs $2,446! Filling out the top five on the list were Anchorage, Bar Harbor, and Fairbanks. The last (#55) on the list and the least expensive tourist destination for vacationers was Clearwater where a three-day trip for two costs $1,630, 40% less than Aspen. To see the whole list: https://nypost.com/2025/07/04/lifestyle/most-expensive-tourist-destinations-in-the-us-in-2025/
Another reason Santa Barbara is so sought after is its local educational system as University of California Santa Barbara ranked as #91 out of 2,250 universities worldwide, and Santa Barbara City College ranked #1 out of the 116 Community Colleges in California. To see these rankings:
https://www.usnews.com/education/best-global-universities/rankings and
https://bold.org/blog/best-community-colleges-in-california
At their December 10th meeting, the Federal Reserve (the Fed) lowered its benchmark interest rate by a quarter percentage point, in a highly anticipated decision surrounded by extraordinary political drama. The new year will bring big changes at the Fed, with major implications for borrowing costs, the housing market, and the overall economy. In addition to major upcoming personnel changes, Fed policymakers have signaled that further rate cuts are unlikely until the spring. That sets up a renewed showdown with President Donald Trump, who has made clear his desire for dramatically lower interest rates. The Fed uses lower interest rates to stimulate the labor market, and higher rates to fight inflation, in line with the central bank’s dual mandate of price stability and maximum employment. The interest rate set by the FOMC is the short-term rate used for overnight lending between commercial banks, and the Fed does not directly control long-term mortgage rates. However, the markets that set mortgage rates move in response to investor expectations about inflation and future Fed policy.
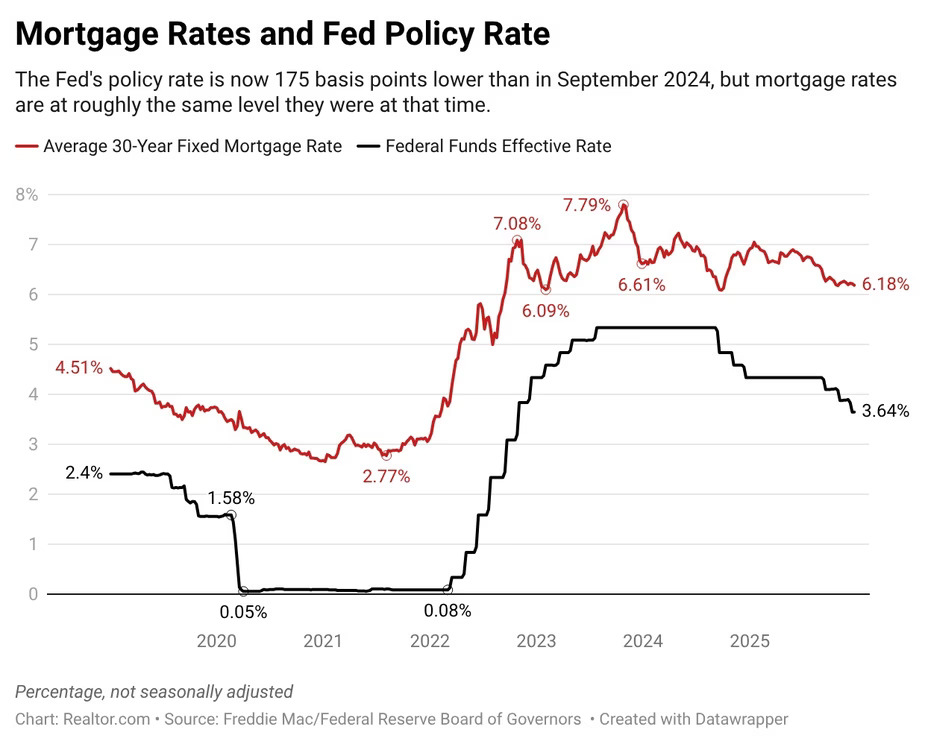
According to Jake Krimmel’s December 24th report: “The Freddie Mac 30-year fixed mortgage rate ticked down 3 basis points this week to 6.18%, from 6.21% last week, landing near 2025 lows of late October. The modest decline reflects a bond market that moved throughout the week—albeit within a tight range—following a mix of cooling and resilient macro signals. A rough November jobs report and a soft but potentially overly-optimistic inflation report last week were followed by a stronger-than-expected third-quarter GDP print yesterday. With Fed policy expectations largely priced in (and few signals about January motives), limited new data amid the government shutdown, and thin holiday trading, mortgage rates continue to drift rather than break sharply in either direction. While this week’s move is small, ending the year with mortgage rates near their lowest level of 2025 is a welcome development for homebuyers heading into 2026. Most of the rate declines this year occurred in late summer and early fall, when seasonal demand was already cooling, meaning that most prospective buyers have not yet fully felt the benefit. Right now, inventory remains higher than last year in most markets, and buyers are heading into 2026 with a meaningfully better rate environment than they faced during the 2025 spring season, when mortgage rates were over 6.80%.”

Since the beginning of 2022, 30-year mortgage interest rates have doubled, but started easing downward in 2024, and are now 6.15% as of January 1st 2026. Historically, the lowest 30-year mortgage interest rate since 1970 was recorded in February 2021 at 2.65% and that low rate was matched in July 2021 during the COVID pandemic. If Buyers are expecting 3% or even low 5% mortgage rates to return to buy a home, they are waiting for an anomaly and they should wait no longer. The highest historical 30-year fixed-rate interest rate was recorded in 1981 @ 18.63%. The average 30-year mortgage rate over the last 50 years has been 7.74%, so current rates are still well below that average. Mortgage rates of 8.03% in October 2023 were at a 23-year high following all-time lows reached just three years before, highlighting the effect that financing costs have on the housing market. A $913,100 loan in 1981 would have been $13,423/month, the payment in June 2021 would have been $3,679/month, and now, as of January 1st, that payment would be $5,563/month. As an alternative to obtaining a mortgage in December 2025, 33%, down from 39% in November, of the Buyers purchased with cash on the South Coast of Santa Barbara County.

The NAHB/Wells Fargo Housing Market Index (HMI) is designed to gauge and track the pulse of the single-family housing market. The HMI is based on a monthly survey of single-family builders who are asked to rate three specific conditions of the housing market. With this data, each month the HMI depicts overall builder sentiment toward housing market conditions on a scale ranging between 0 and 100. A higher reading (>50) is an indication that the majority of builders feel confident about the current and near-term outlook for housing. Lower readings signify less optimism among builders. In December 2025, builder confidence in the market for newly built single-family homes rose one point to 39, current sales conditions increased one point to 42, sales expectations in the next six months rose one point to 52 and traffic of prospective buyers held steady at 26. The latest HMI survey revealed signs of a cooling market with 40% of builders reporting cutting asking prices, marking the second consecutive month the share has been at 40% or higher since May 2020. It was 41% in November 2025. Meanwhile, the average price reduction was 5% in December, down from the 6% rate in November. The use of sales incentives was 67% in December, the highest percentage in the post-Covid period. To review the whole article; https://www.nahb.org/news-and-economics/housing-economics/indices/housing-market-index

As for the worldwide cost of living as of January 1st, Expatistan compiled an index of 116 major worldwide metropolitan areas. According to the index in the United States (and the world) the most expensive area to live in is #1 New York City with a @ 243 Price Index score (the least expensive gallon of regular gas costs $2.89/gallon in New York). The least expensive in the United States is #92 Cedar Rapids, Iowa @ 84 ($2.20/gallon). The lowest State average gas price in the United States is $2.25/gallon in Oklahoma. In searching the entire state of California, the least expensive gallon of gas can be found in Shasta County @ $2.99/gallon, while the most expensive is in Mono County @ $5.57. Of the top 25 most expensive areas on the worldwide list, two are in California: #5 San Francisco @ 204 ($3.69/gallon) and #10 San Diego @ 174 ($3.89/gallon). According to the index, the least expensive area to live in the world is #116 Yogyakarta (Indonesia) @ 32 ($3.12/gallon). Gas prices on the South Coast are as low as $4.32/gallon and are generally lower than in other California coastal areas. Some Santa Barbara stations near the 101 Freeway exit ramps are charging up to $5.59/gallon. According to AAA, the average cost of a gallon of gas in California is $4.27/gallon, while the National average is $2.83/gallon. Expatistan’s Cost of Living Index is an interesting way to compare the cost of living in cities around the world. https://www.expatistan.com/cost-of-living/index
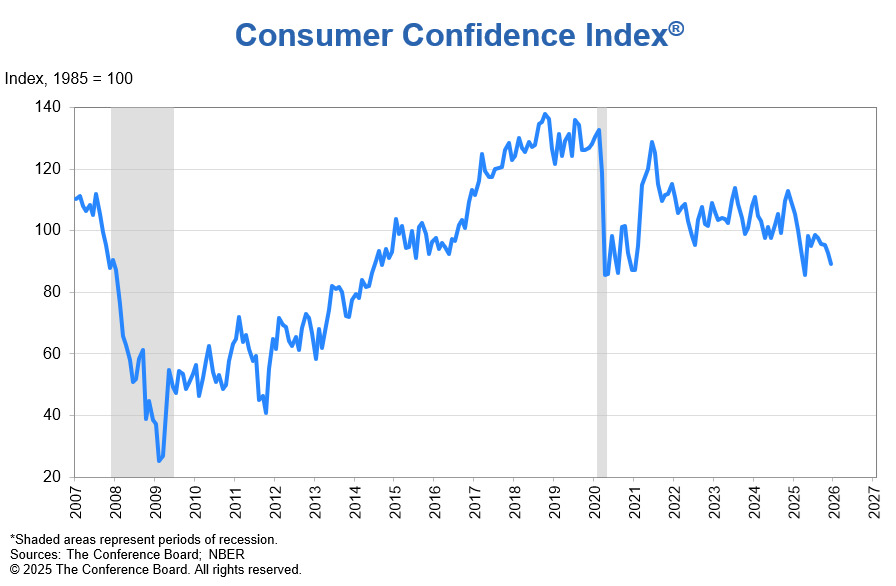
On December 23rd the Consumer Confidence Index declined by 3.8 points to 89.1 (1985=100), from 92.9 in November. This includes an upward revision to November’s reading, as responses collected after the end of the federal government shutdown (which spanned October 1 to November 12) were more positive than those collected during the impasse. “Despite an upward revision in November related to the end of the shutdown, consumer confidence fell again in December and remained well below this year’s January peak. Four of five components of the overall index fell, while one was at a level signaling notable weakness,” said Dana M Peterson, Chief Economist, The Conference Board. The Present Situation Index declined as net views on current business conditions were negative for the first time since September 2024, a month that included a labor market scare and deadly hurricanes. Perceptions of employment conditions edged lower as the labor market differentia (the share of consumers saying jobs are ‘plentiful’ minus the share saying jobs are ‘hard to get’) continued to sag. Two of the three Expectations Index components dipped in December. November’s nosedive in expectations for business conditions six months from now mostly reversed in December but remained negative. Expectations for labor market conditions were gloomier, and the outlook for household incomes was less positive. https://www.conference-board.org/topics/consumer-confidence
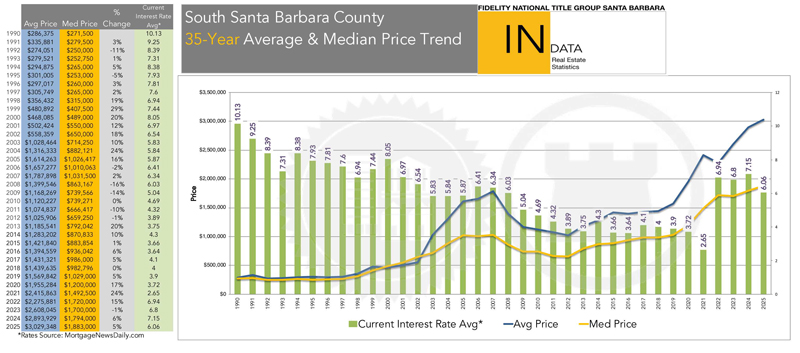
Historically, the highest Year-to-Date median sale price on the Santa Barbara South Coast was recorded in 2007 at $1,031,500, but that high mark is now ancient history. The median sale price of all residential 2025 sales Year-To-Date as of December 31st was $1,883,000, up 5% from 2024 and the average sales price was $3,029,348. While the median sale price had been hovering near 2007’s historic high for most of 2017, 2018, and 2019, it started its upward climb in 2020, accelerating in 2021 and into the first half of 2022 before leveling off throughout and declining 1% in 2023. There have been no double-digit price increases in the median sales price since a 17% jump in 2020, 24% in 2021 and 15% in 2022.
Based on the Santa Barbara Multiple Listing Service data, as of January 1st in the City of Santa Barbara, there were 52 active House/PUD listings (down from 82 on December 1st) and 24 pending sales (down from 25 on December 1st) which equates to a 2.2-month supply (down from 3.3 on December 1st) of listings for Buyers to choose from in the City of Santa Barbara. Generally, a 1-month supply would indicate the listings would be sold within one month. A less than 1-month supply of inventory suggests a feverish Seller’s market, a 1-to-2-month supply indicates a heated Seller’s market, and a 2-to-4-month supply would be considered a basic Seller’s market where Buyer demand is still high, and inventory is scarce. Historically, a 4-to-6-month supply of available inventory would indicate a fairly Balanced, normal market between Buyers and Sellers. More than a 6-month supply is considered a Buyer’s market where inventory is plentiful, with Buyers being slower to make decisions as they compare the numerous properties on the market. Based on Santa Barbara Multiple Listing Service data as of January 1st, Carpinteria/Summerland has a 2.2-month supply (the same as on December 1st), Montecito has a 5.3-month supply (far down from 10 on December 1st), Hope Ranch has a 16-month supply (down from 19 on December 1st), and Goleta has a 1.8-month supply (up from .8 on December 1st). Carpinteria/Summerland remains in a Basic Seller’s market. Montecito has moved into a Balanced market. Santa Barbara remains in a Basic Seller’s market. Hope Ranch remains far into a Buyer’s market. Goleta has moved into a Heated Seller’s market. With a combined total of 53 House/PUD pending sales (down from 68 on December 1st) and 147 active listings (down from 196 on December 1st) along the South Coast of Santa Barbara County, there is a 2.8-month supply (down from 2.9 on December 1st) of House/PUD listings from which Buyers can choose. By removing the 53 higher-valued House/PUD listings in Montecito and Hope Ranch and their 8 pending sales from the equation, there is only a 2.1-month supply (the same as on December 1st) from which Buyers can choose along the South Coast of Santa Barbara County. With a combined total of 27 Condominium pending sales (down from 29 on December 1st) and 46 active listings (down from 64 on December 1st), there is a 1.7-month supply (down from 2.2 on December 1st) of Condominium listings from which Buyers can choose.
There are many concerns for Buyers and Sellers. These include the war in Ukraine, continuing tensions in the Middle East, continued worldwide geopolitical tensions, inflation, insurance premium volatility, mortgage interest rates, health insurance rates, President Trump’s on-and-off-again tariffs, continuing repercussions of the government shutdown, geopolitical tensions, and how other administration economic policies are confusing to our trading partners. Also, a major concern for Buyers and Sellers is the scarcity and cost of homeowners’ insurance coverage, especially since State Farm, Nationwide, Kemper, Marine America, Trans-Pacific, Allstate and others have refused to issue new policies in California and are not renewing existing home insurance policies. Farmers Insurance has been restricting the number of new policies it offers since July 2023, but recently removed the cap on the number of new policies it will issue, which should put pressure on other insurance companies to do the same.
California’s Proposition 19 allows homeowners aged 55+ to transfer their existing real estate tax base to a home anywhere in the State; this newer law may encourage some older Sellers who wish to sell their current homes and downsize. The imbalance between Santa Barbara’s low housing supply and high demand is more pronounced than in most national cities, so over the years, there has been a surge in local property values. While market corrections may still negatively impact property values on the Santa Barbara South Coast, the impact is expected to be less severe compared to many other areas in the state and country. New 2026 listings may have remained on the market a bit longer than in 2024 and 2025, but they continue to sell. Home values in the Santa Barbara South Coast Real Estate Market continue to be supported by supply and demand dynamics due to our current market’s persistent low listing inventory; pre-pandemic House/PUD active listings in January 2020 totaled 423, and now, as of January 1st, there are only 193 active listings, which is 28% lower than in 2020.
Review the attached list of the 102 properties sold on the Santa Barbara South Coast in December 2025, and contact me for information on specific sales in our area.
Happy 2026 to All!
Stan Tabler, CRS, GRI, ABR, GREEN
Compass
801 Chapala Street
Santa Barbara, CA 93101
805.689.2305
CalBRE Brokers License #00774377 since 1980
Leave a Reply